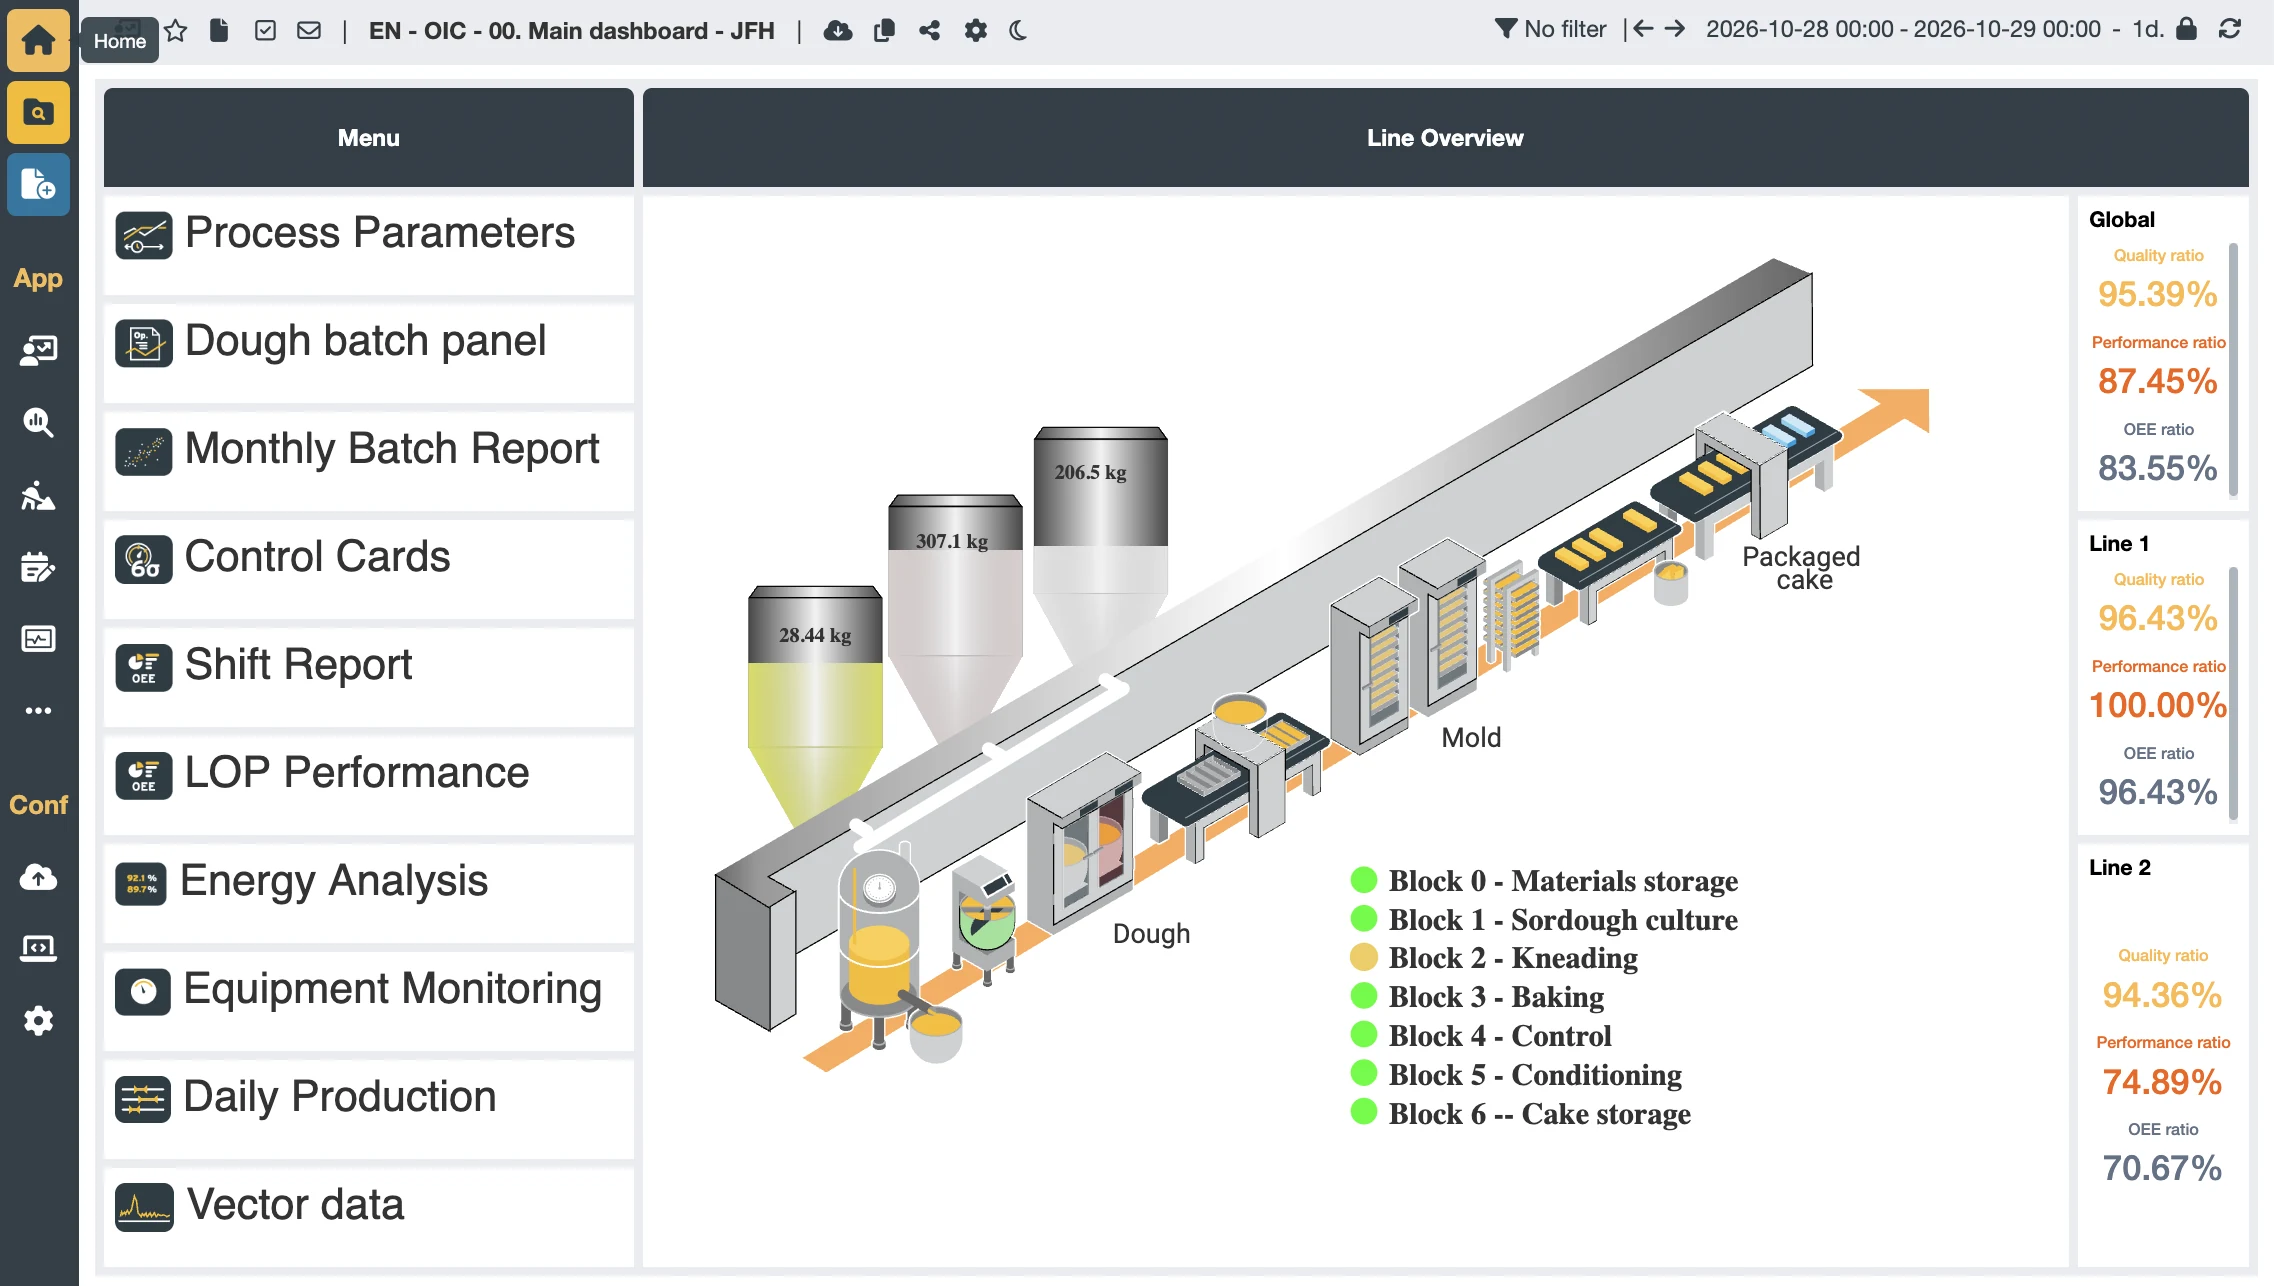
Operators think of their process as a diagram. OIAnalytics synoptics give them that familiar view, driven in real time by your data.
What synoptics do
Synoptics embed animated graphical views in your dashboards. You import an SVG image of your installation, then link each of its objects to OIAnalytics data. Each object is animated based on the values: color changes, blinking alarms, value display, tank fill levels…
What you gain
Instant reading of process status: operators see the representation they already know.
Anomalies spotted at a glance: colors and blinking draw attention where it is needed.
A view beyond supervision: display computed KPIs, analysis or model results on the diagram, not only raw measurements.
No development: animations are configured with no code.
Key features
Synoptics driven by contextualized data: use them in time-based, asset or batch dashboards, showing the selected batch or equipment.
Simulation mode to test animations before going live.
Import of SVG files created with the drawing tool of your choice.