Your historical data holds the answers to your quality, yield and consumption issues. OIAnalytics advanced analytics lets your process experts find them on their own.
What advanced analytics does
Advanced analytics offers guided workflows that apply statistical and AI techniques to your already contextualized data, with no prior preparation.
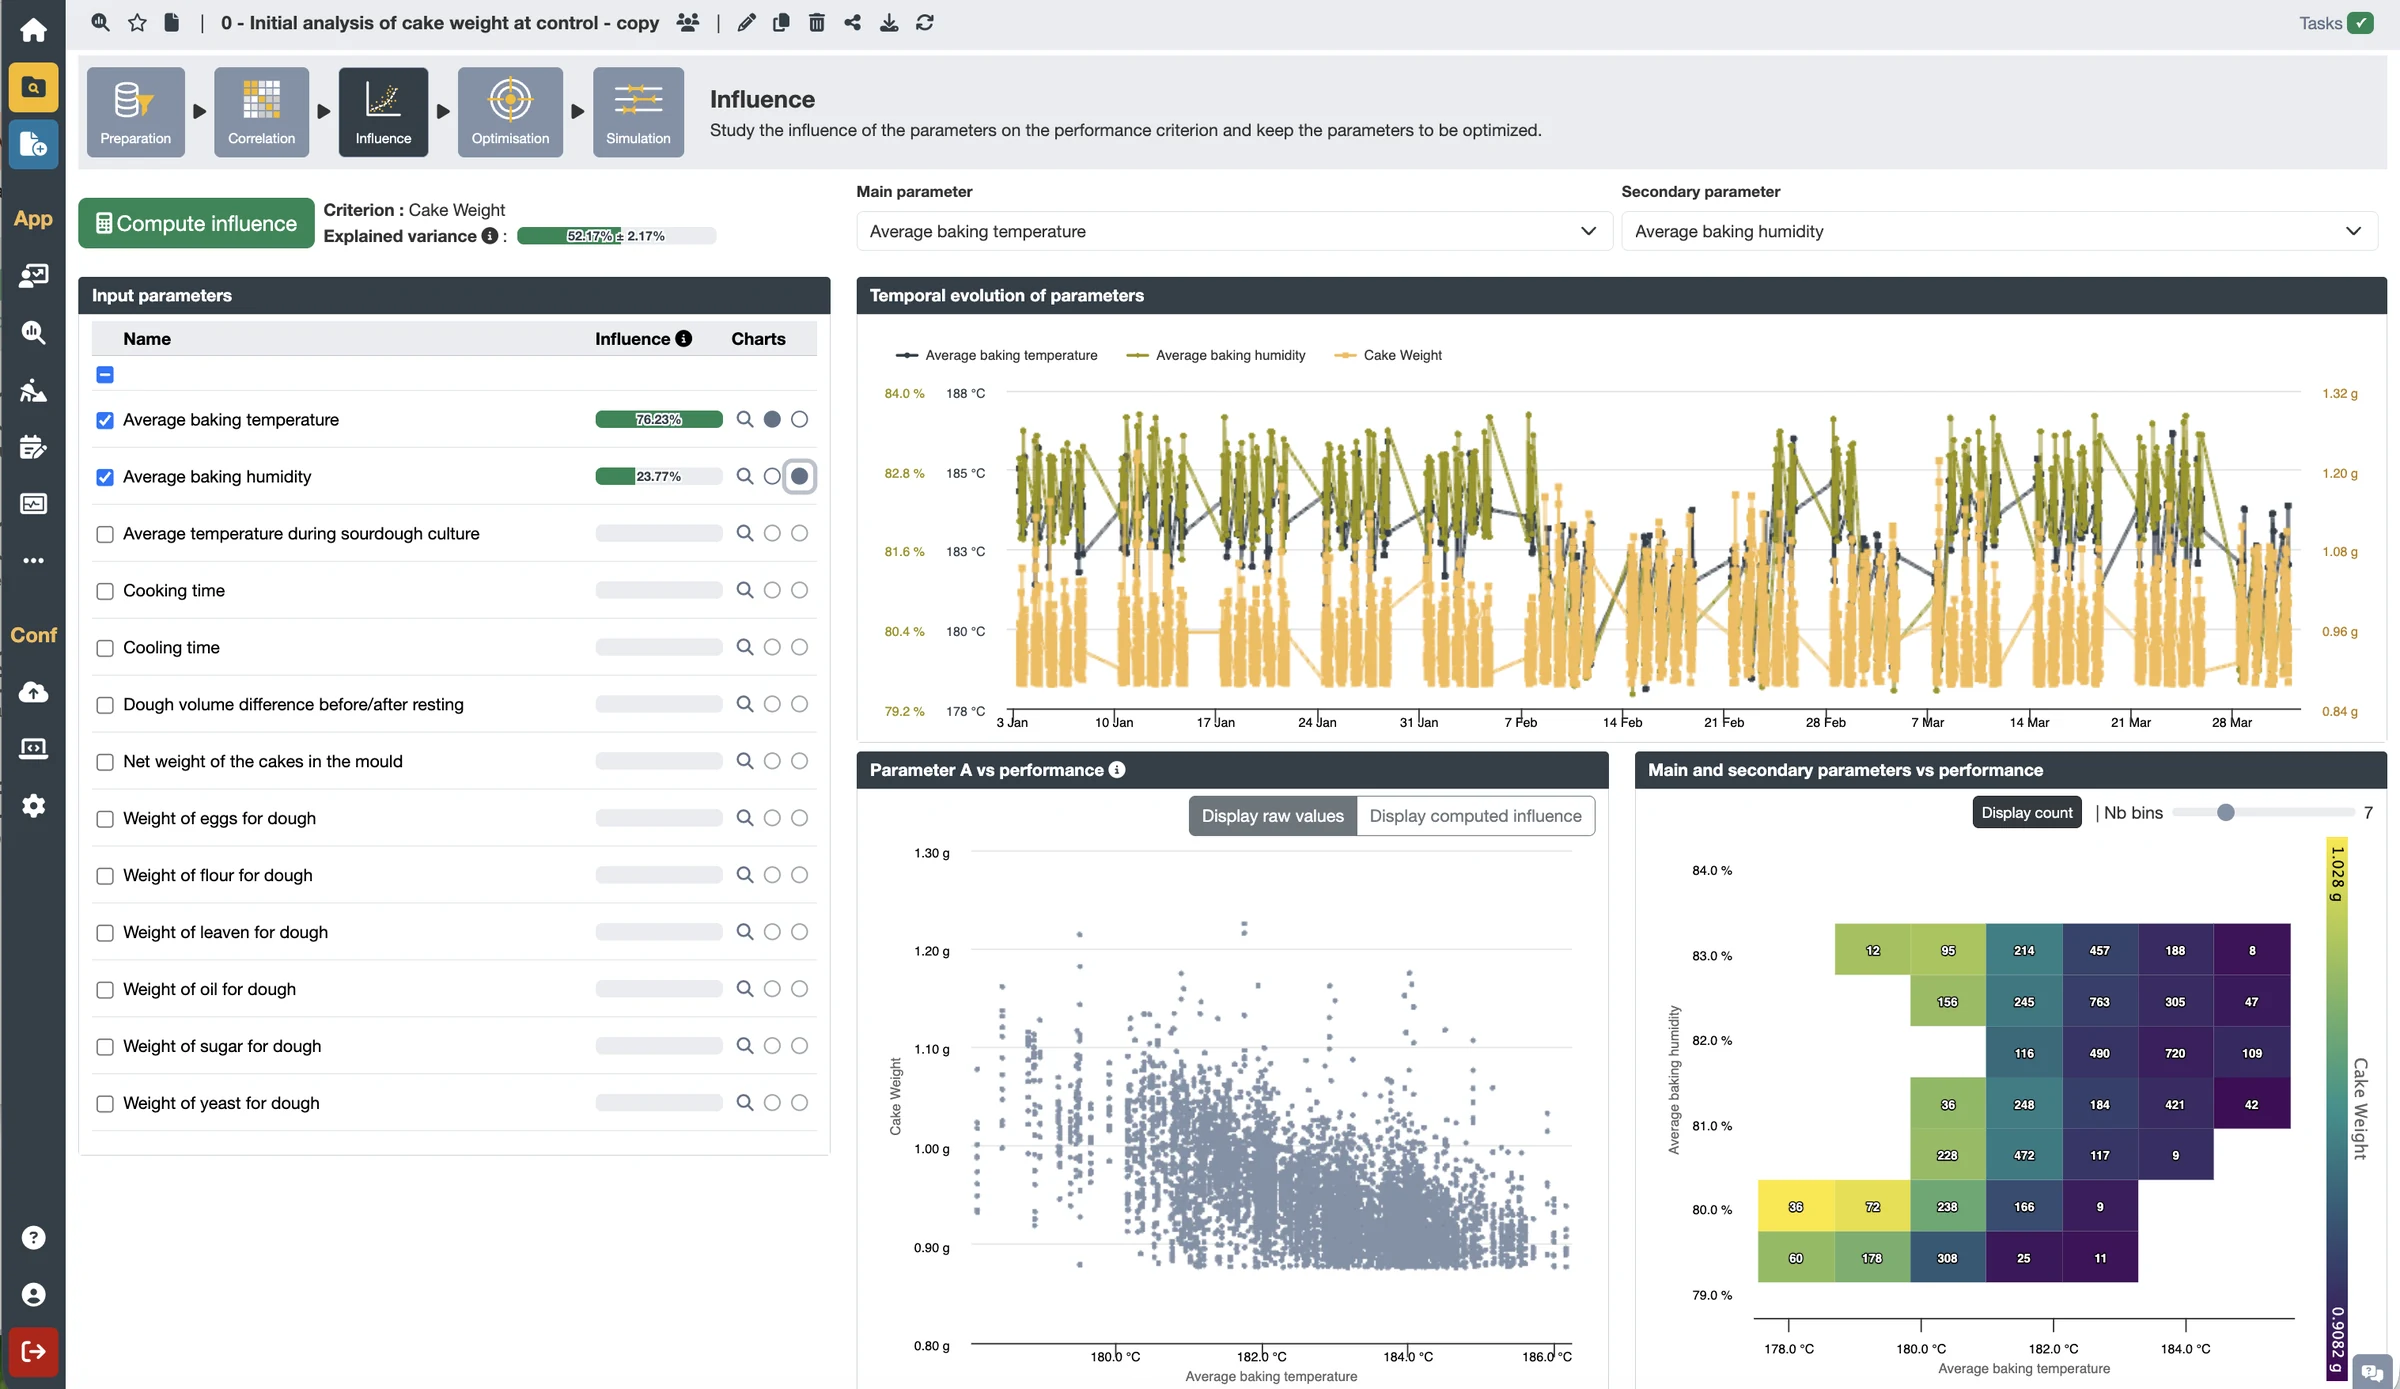
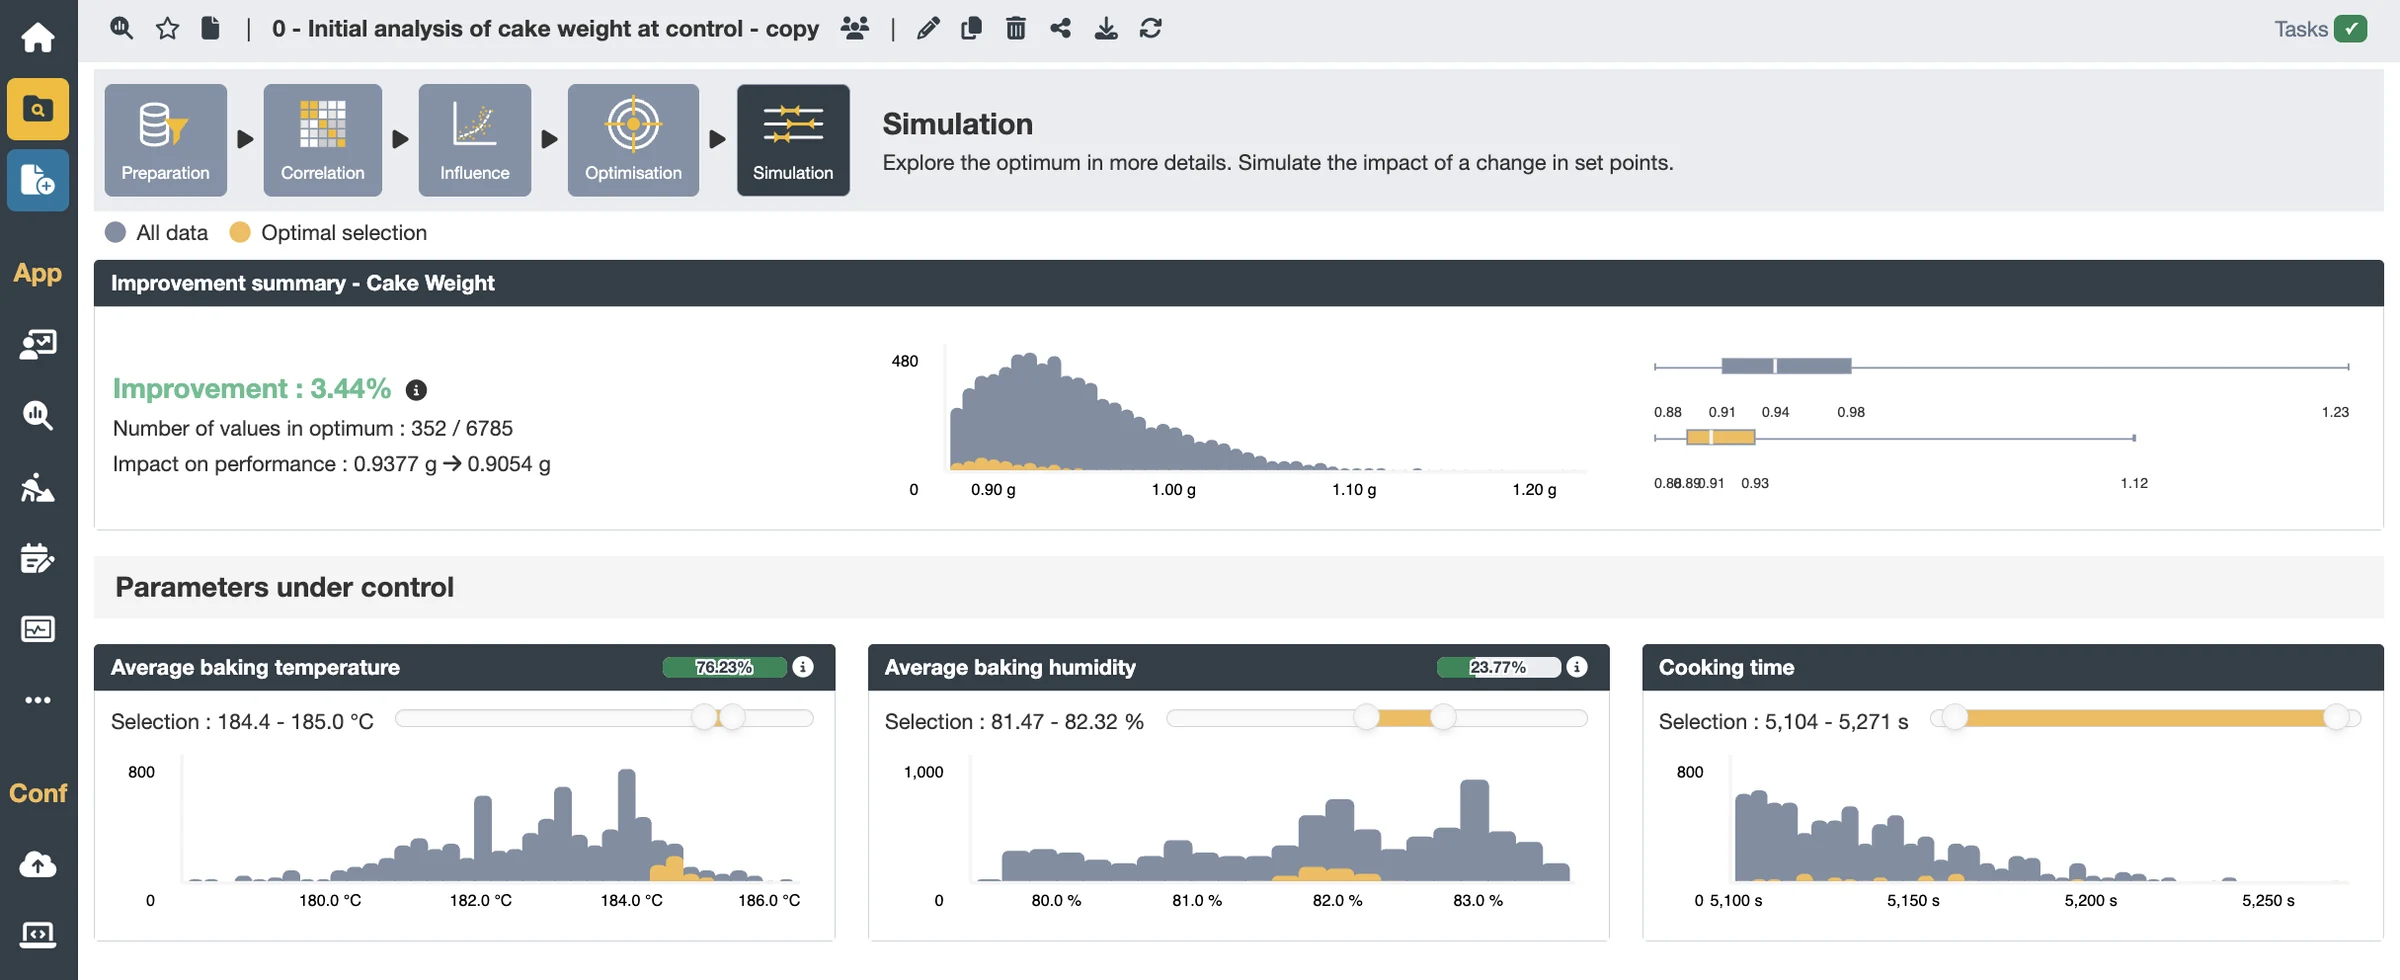
Influence and optimization analysis: identifies the process parameters that influence a KPI (quality, yield, consumption…) and recommends optimal operating conditions with the estimated potential gain. It combines multivariate analysis (XGBoost and Shapley values) with clustering-based optimization.
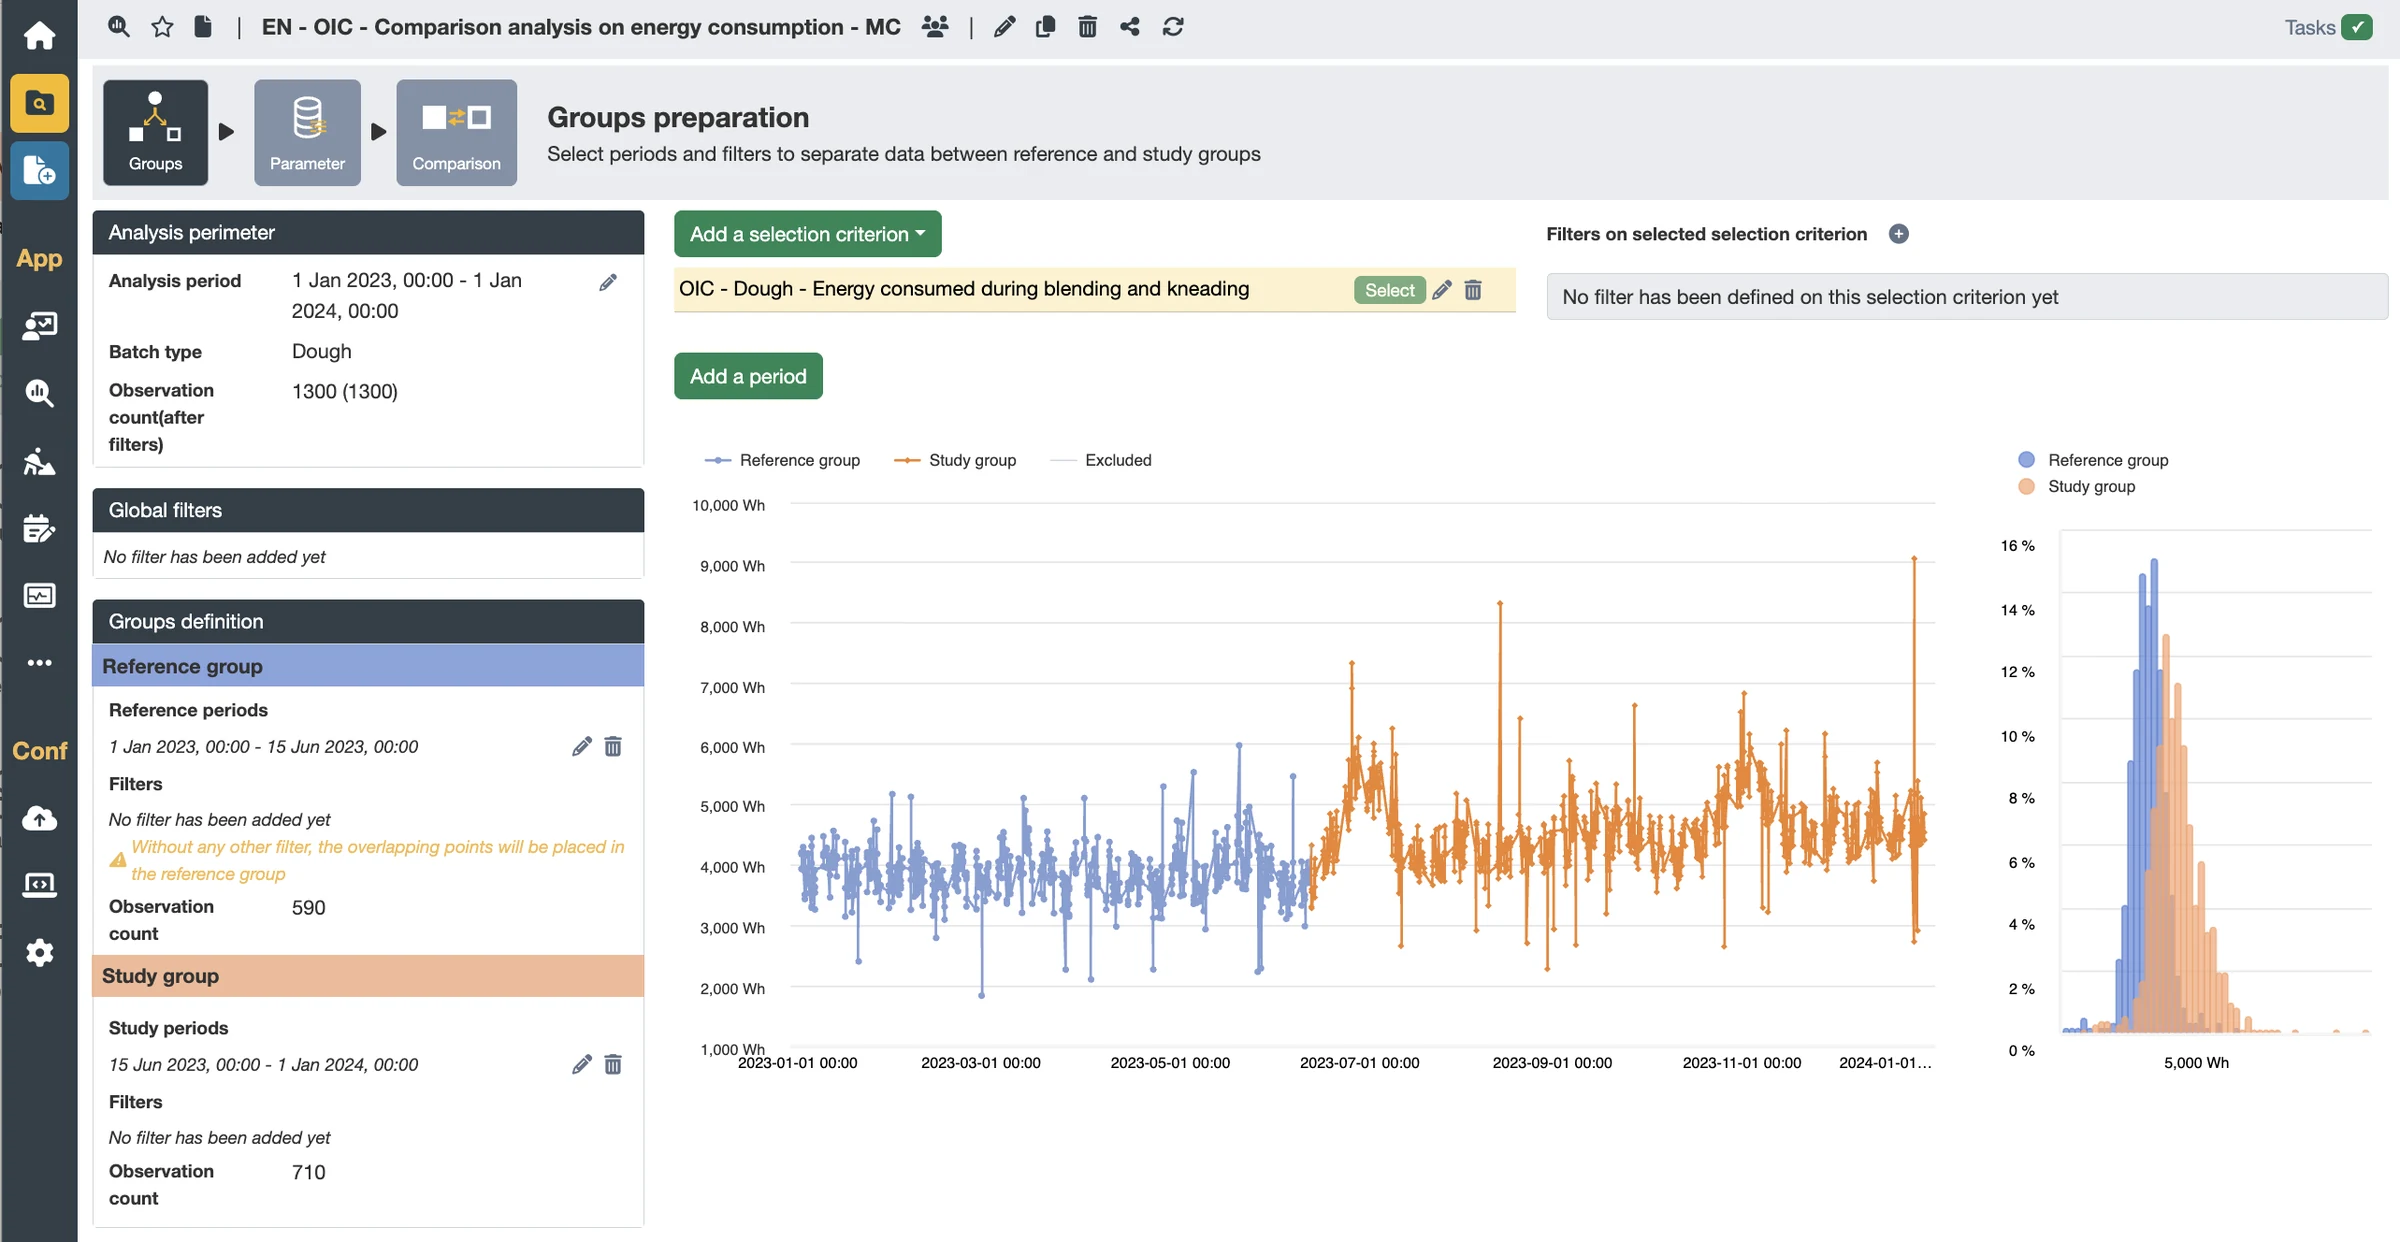
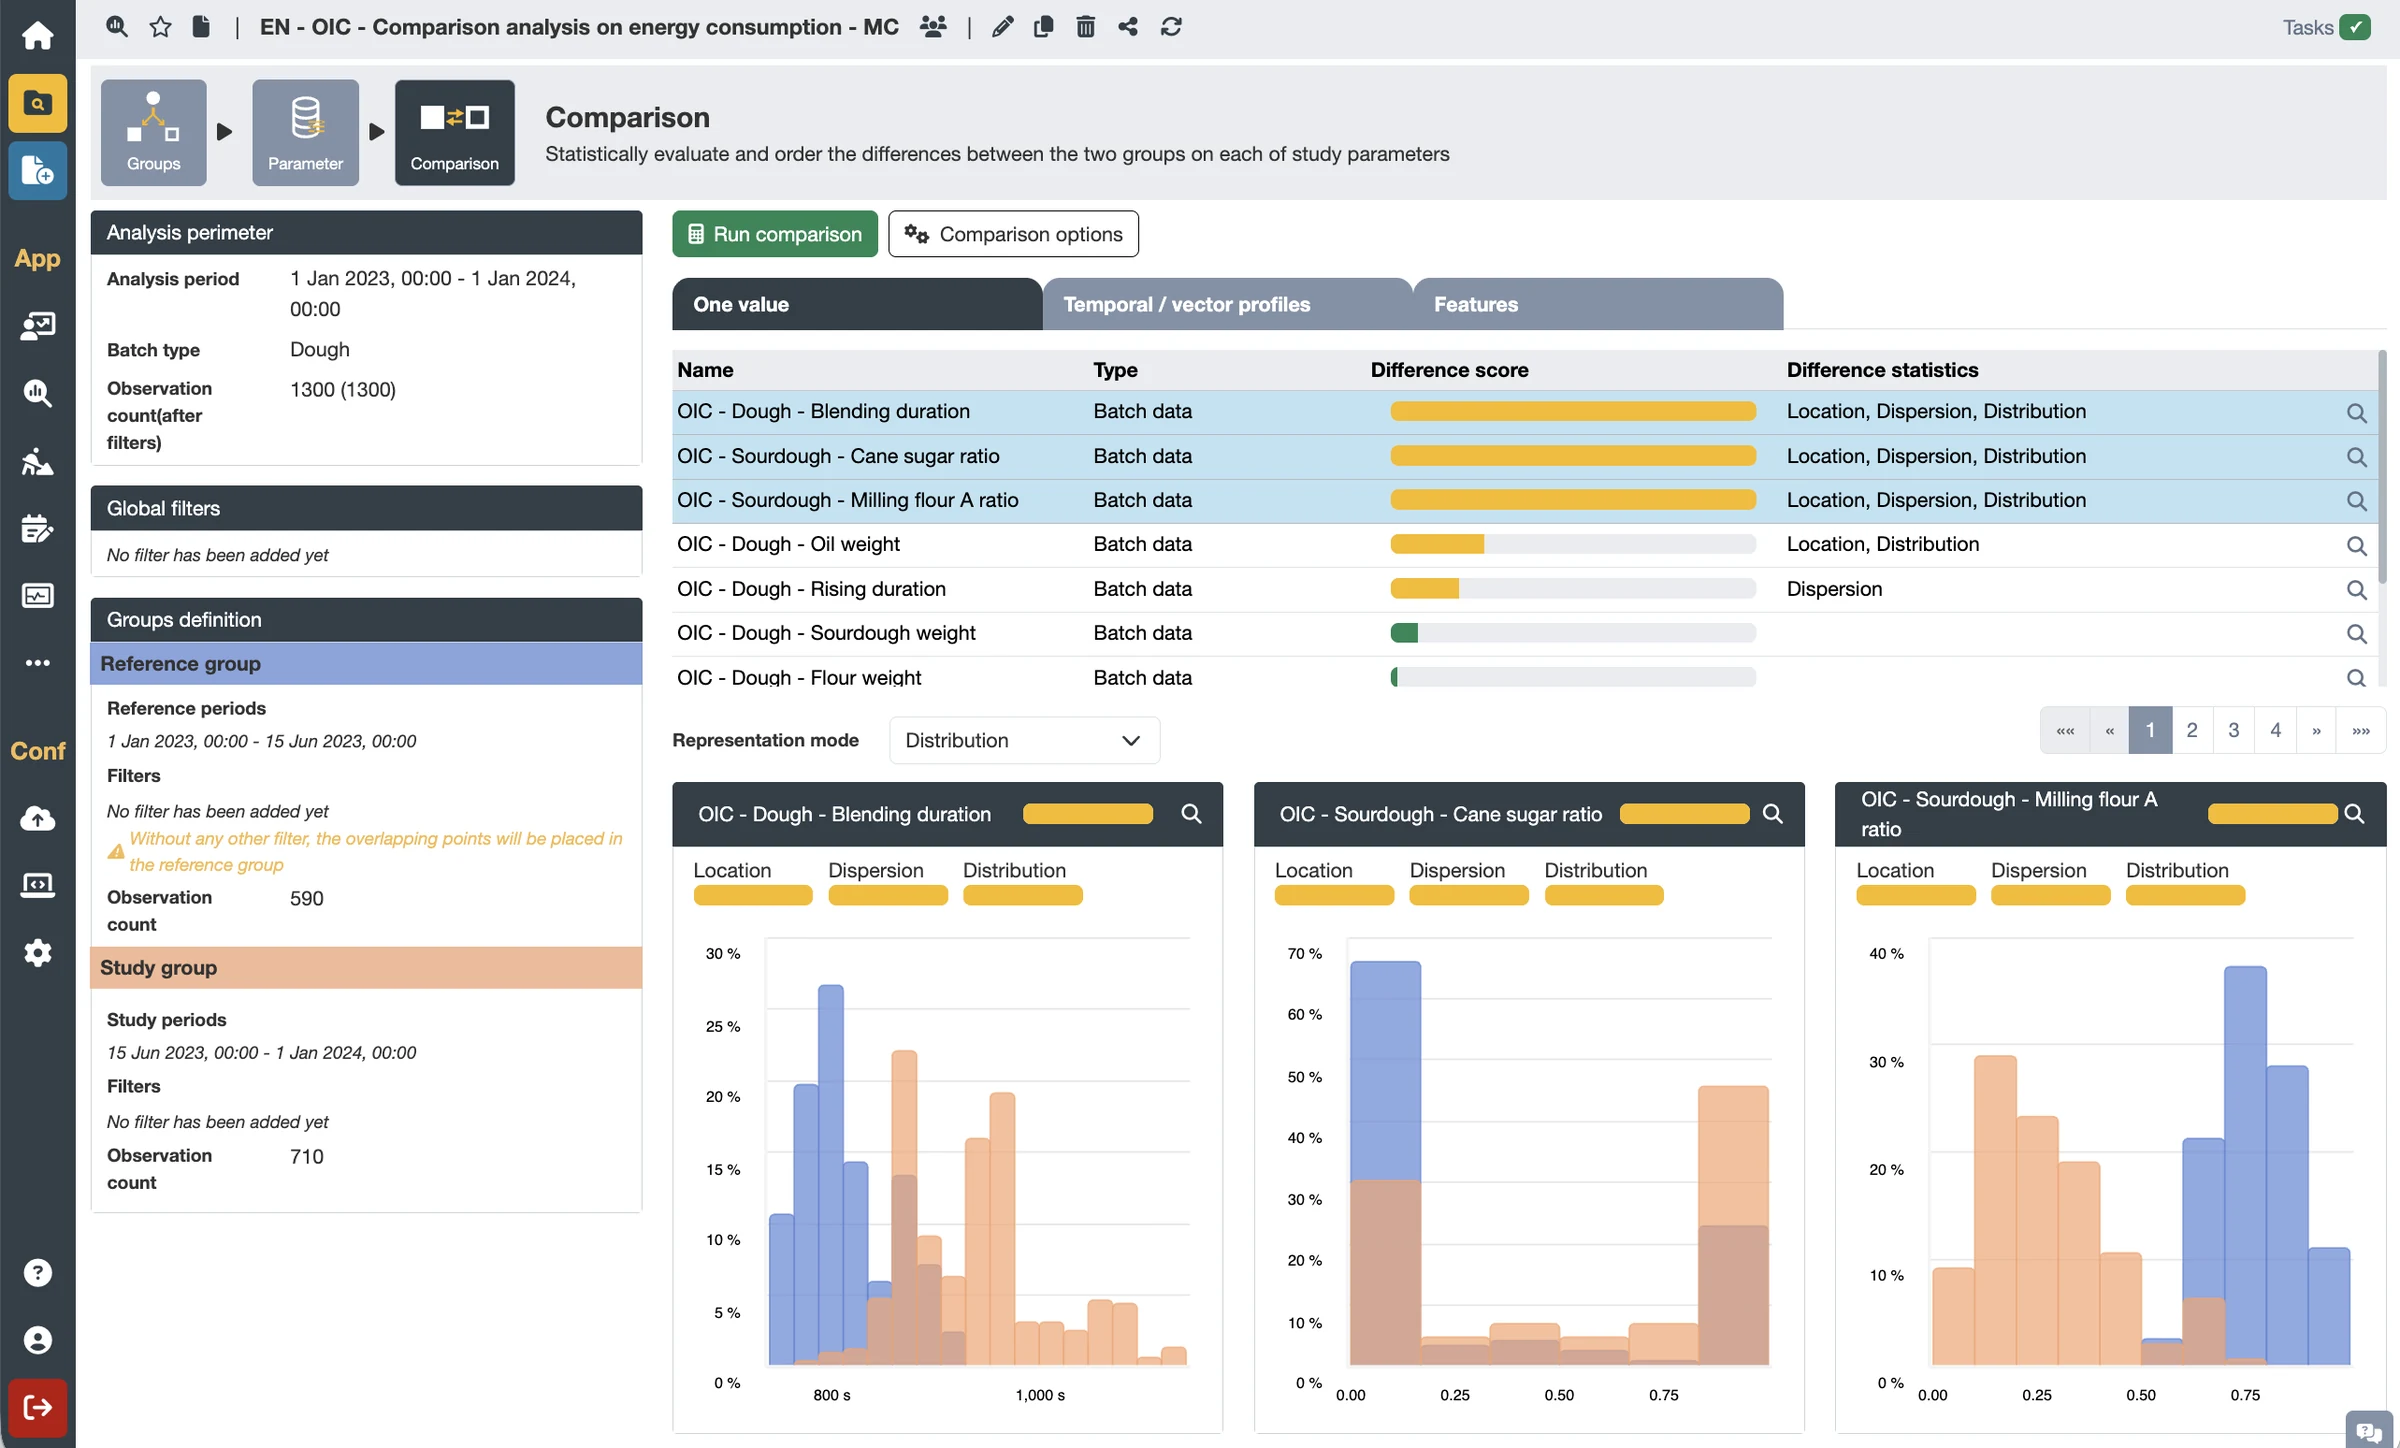
Comparison analysis: compares two groups of batches (product, recipe, equipment, phase…) or two time ranges to isolate the parameters that set them apart, using non-parametric statistical tests, including on time profiles and vector data.
Common-cause detection: spots, period by period (day, week, month), the batch or cycle categories with atypical behavior (raw material supplier, tooling, equipment…), even when they are not abnormal over the whole history.
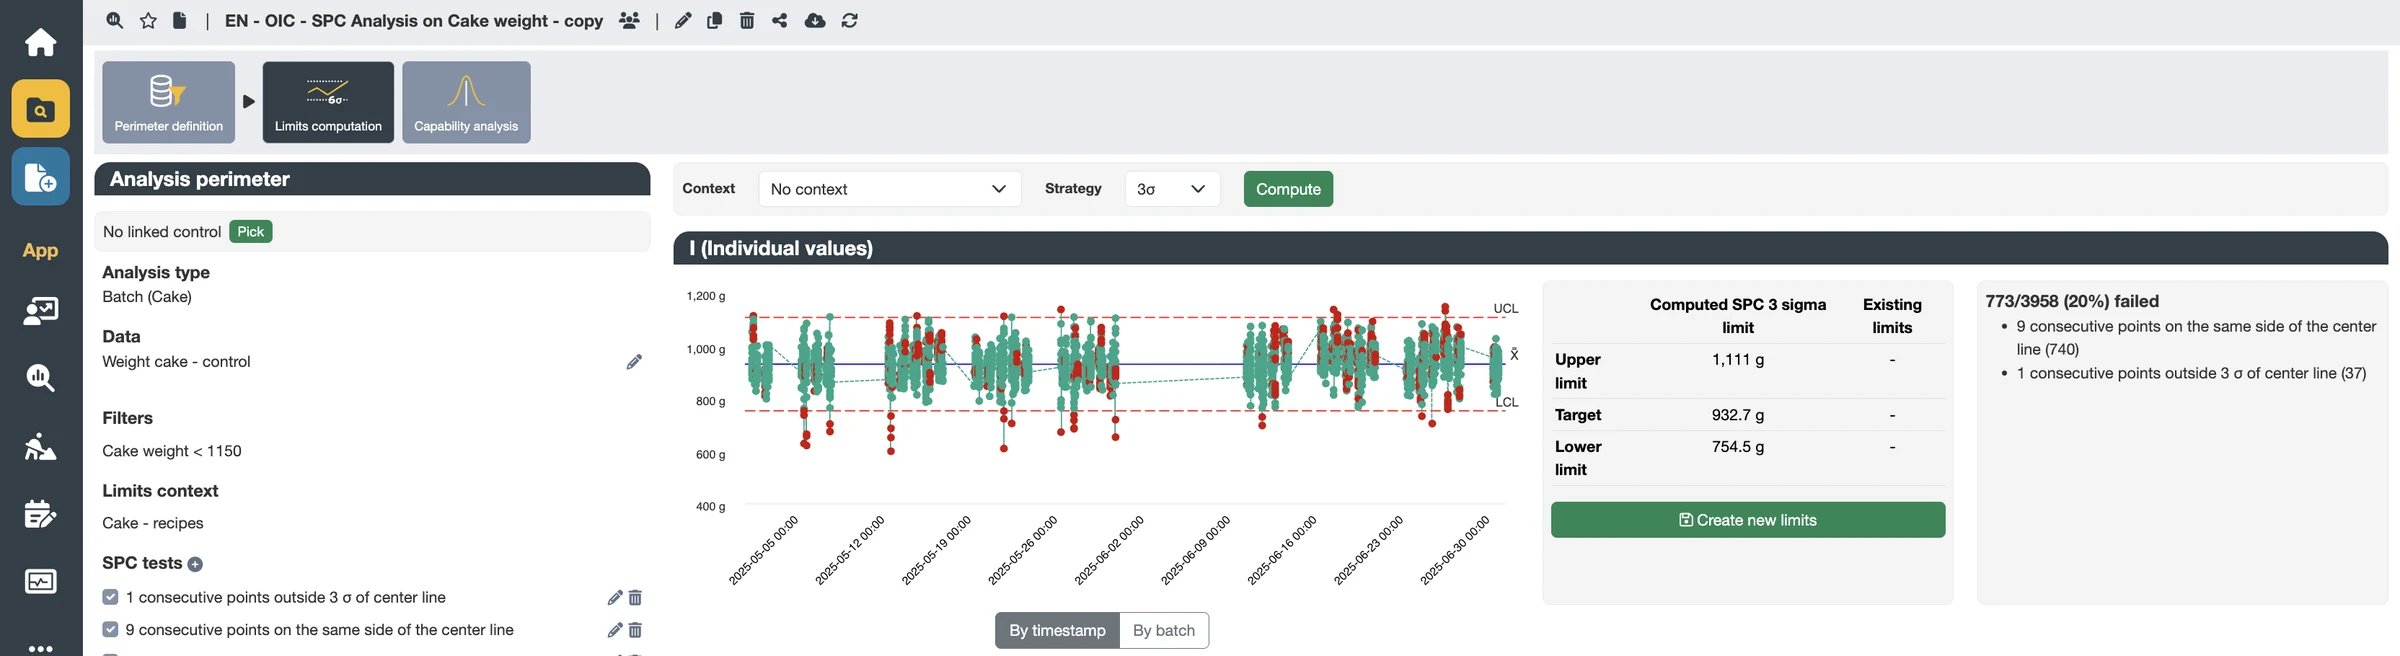
SPC analysis: checks process stability and capability (Cp, Cpk, Pp, Ppk). It also helps you determine the limits and rules for your control charts.
What you gain
Measurable gains on key KPIs: quantified optimization recommendations on quality, yield or consumption.
Faster problem solving: causes of defects or drifts are identified without data extraction or back-and-forth with a data scientist.
No data science skills required: workflows guide users step by step.
Fact-based decisions and process knowledge that is captured and shared.
Key features
Analyses that start from contextualized data: batches, phases, events, quality and operator data are available with no extraction or preparation, whereas traditional analytics tools start with a long data preparation phase.
Explainable AI designed for adoption: many views let experts validate the solutions suggested by the algorithms before applying them.
Results you can act on within the platform: limits from SPC analysis feed controls.
Statistics and AI in the same solution as data collection, visualization and monitoring: one tool instead of a stack of specialized software.
Comparison of time profiles and vector data (spectra, chromatograms).