Ensuring the quality, stability and availability of your plant means watching hundreds of parameters. OIAnalytics automates that monitoring and alerts your teams at the right time.
What statistical process control does
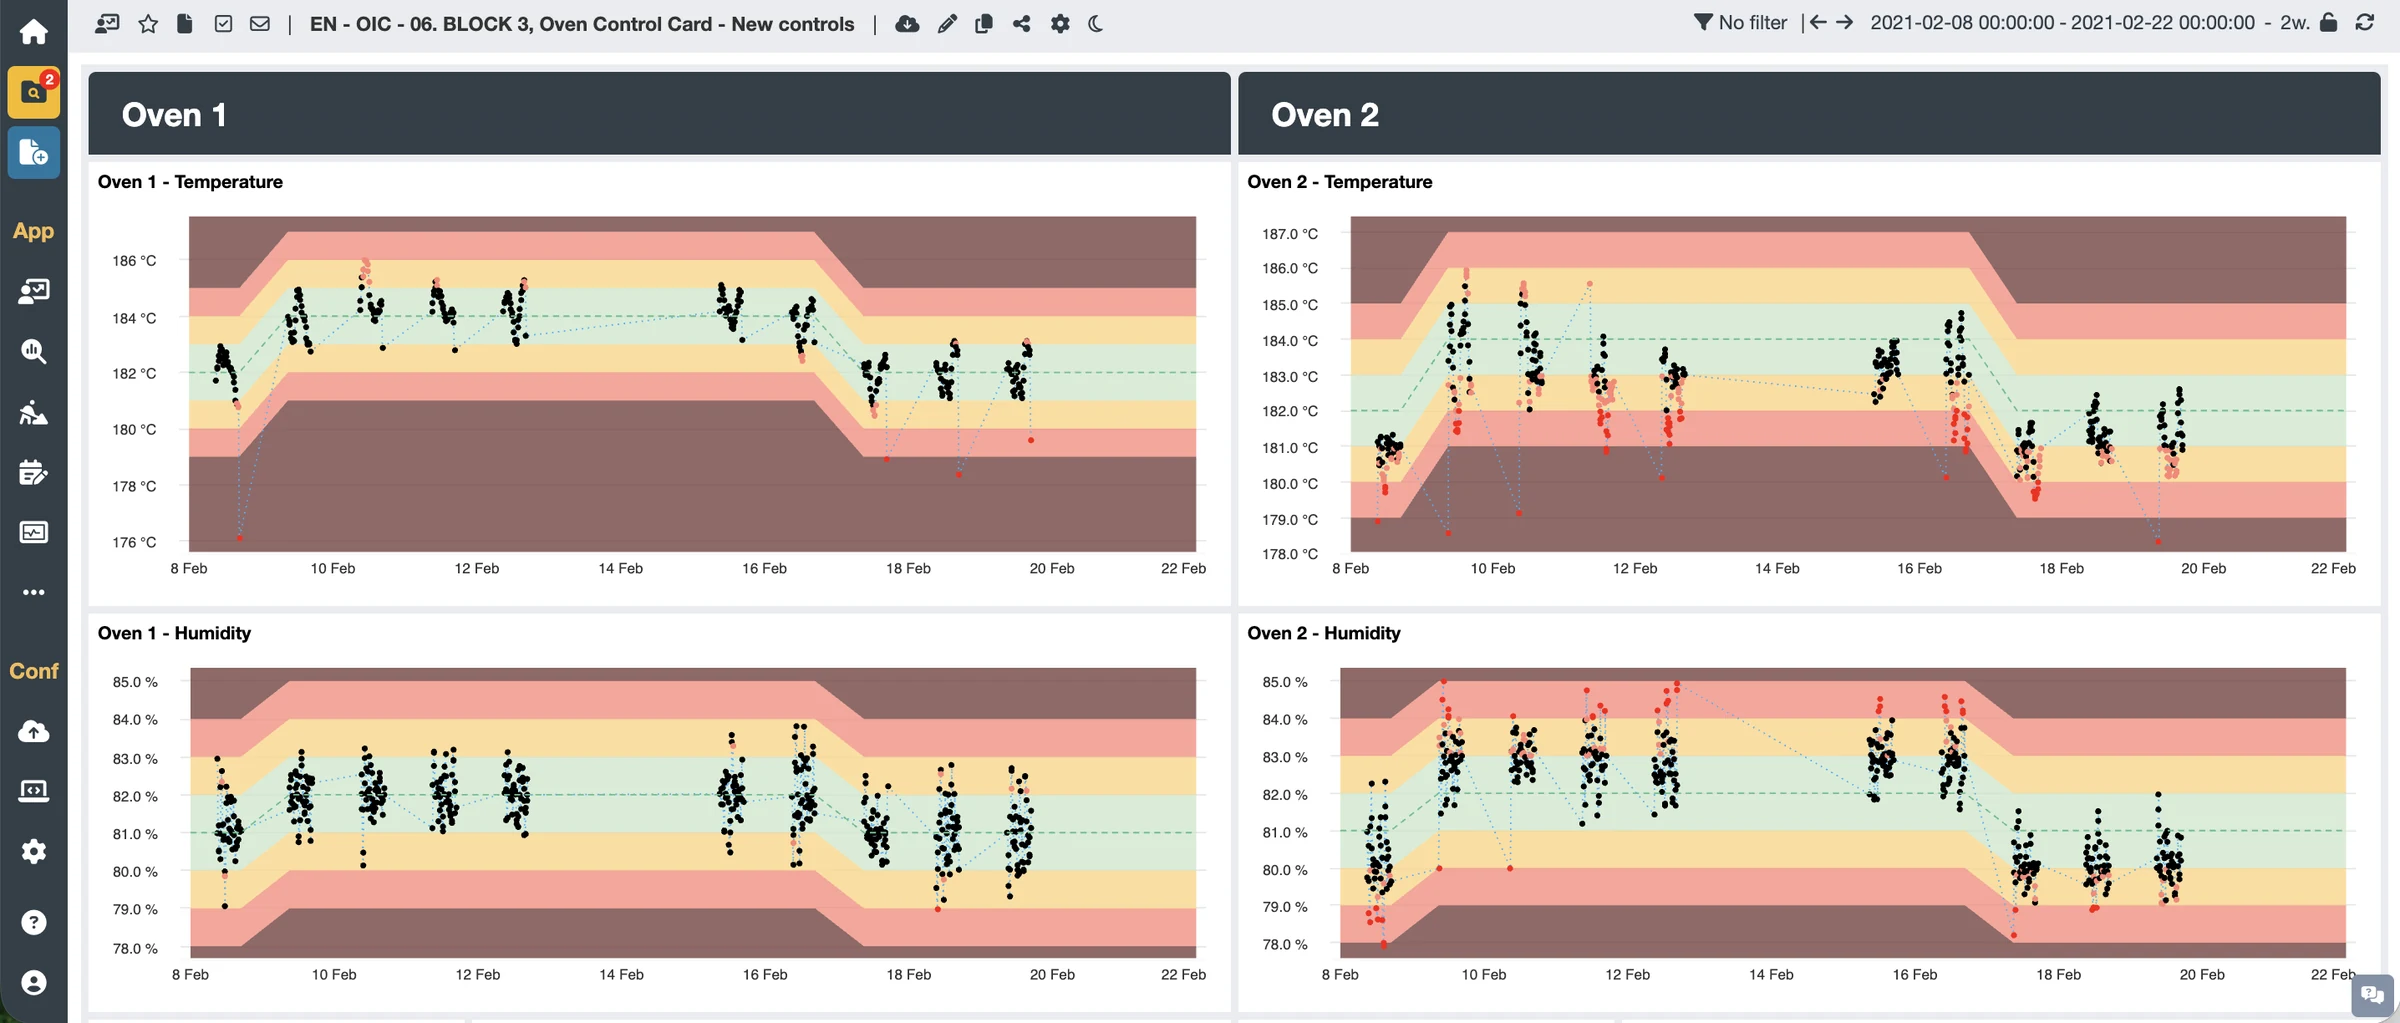
The Controls module continuously monitors your process and equipment parameters, whether continuous or batch. You define rules (fixed, variable or computed limits, trends, off-centering, SPC tests) and the context in which they apply: for example, monitoring a tank temperature only during production, excluding heating and cooling phases.
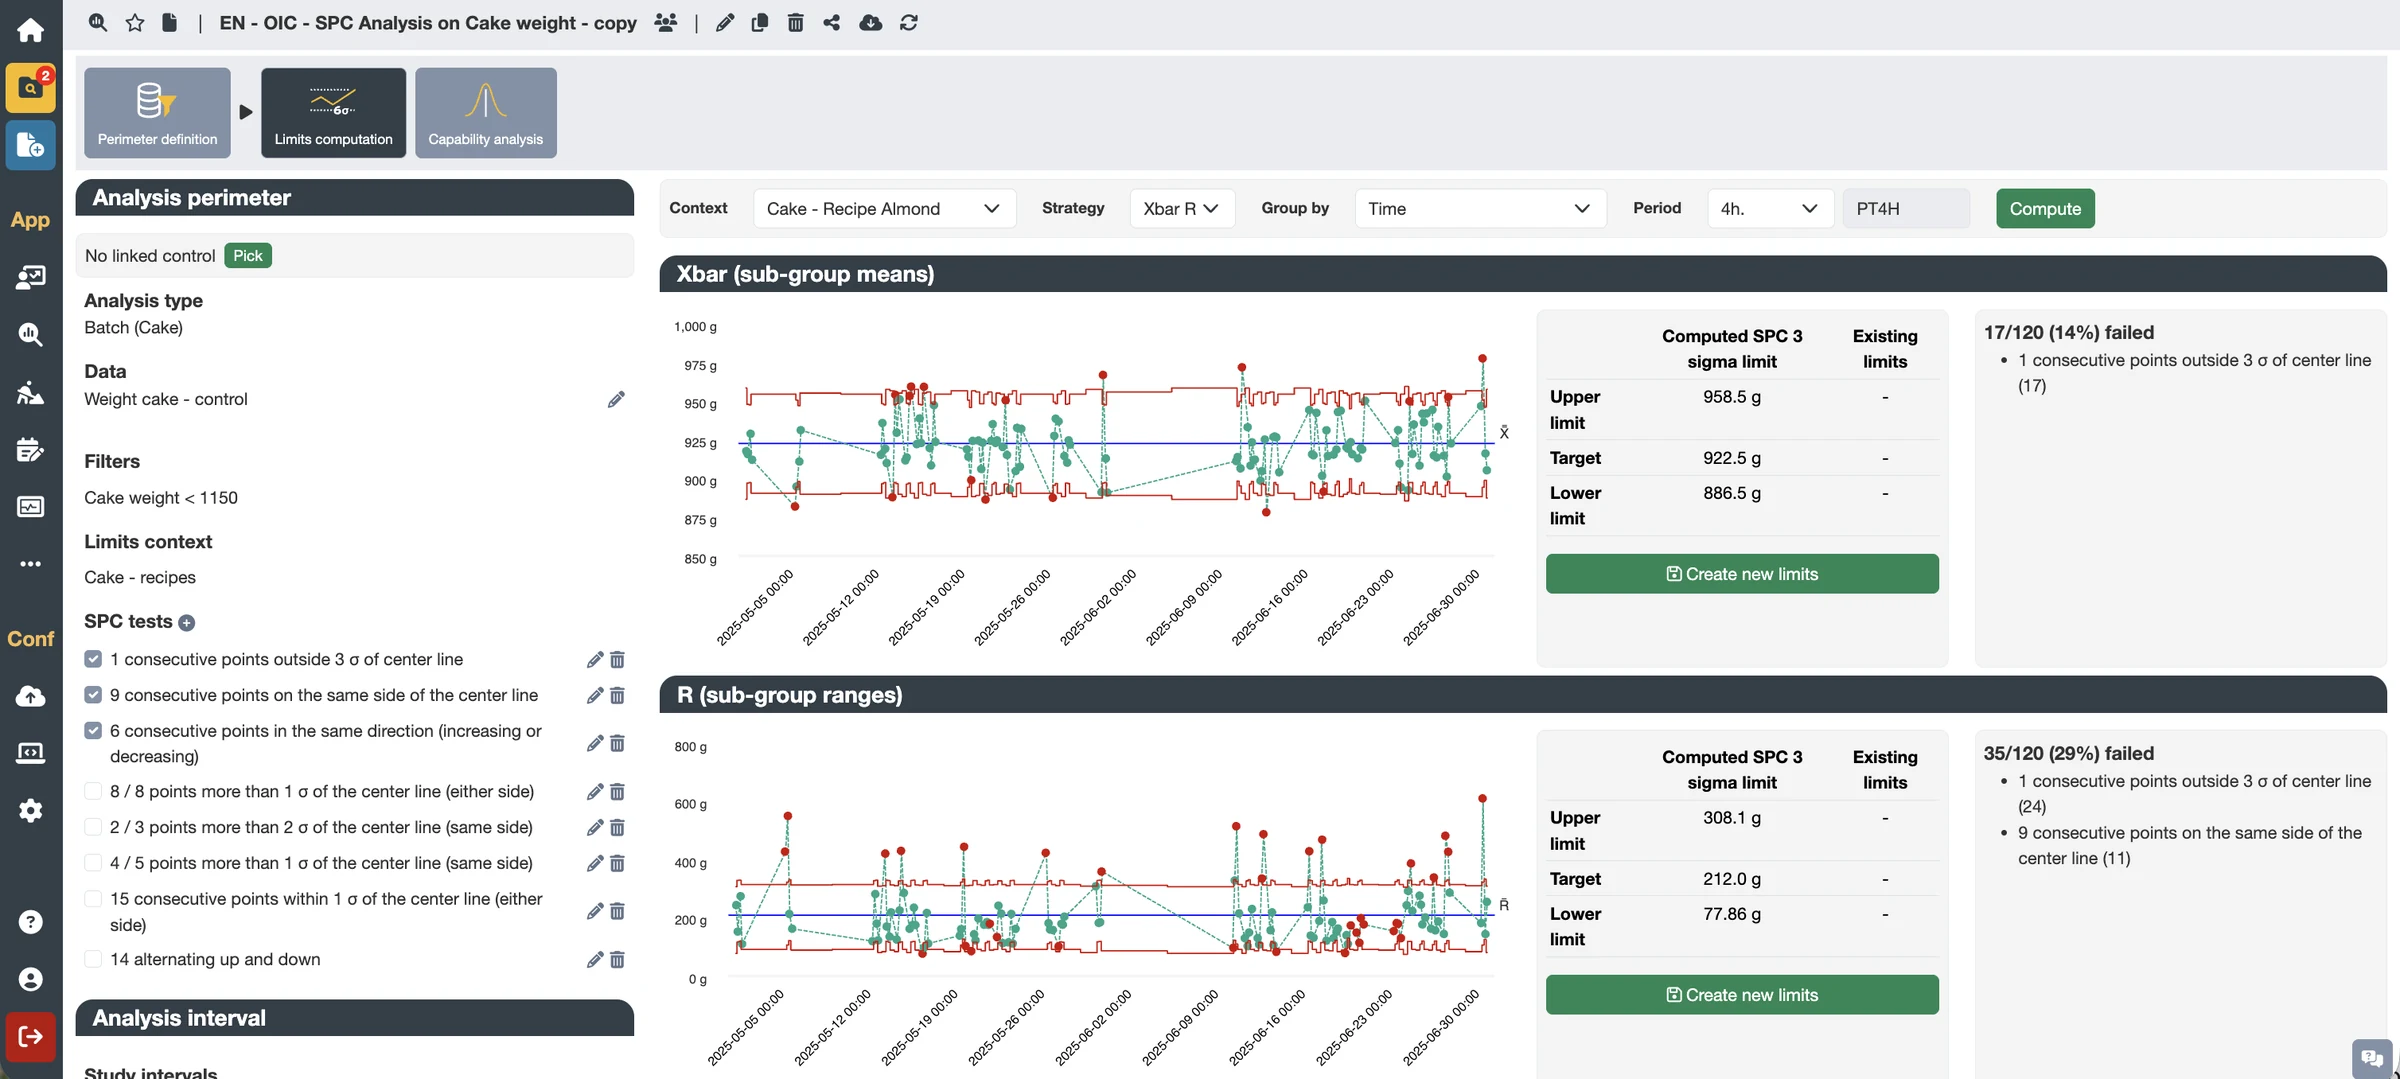
The SPC Analysis function completes the setup: it checks whether a process is in control, separates normal variation (common causes) from abnormal variation (special causes) and measures capability (Cp, Cpk, Pp, Ppk). It also lets you define, based on historical data, the control limits and rules to apply.
What you gain
More parameters under control, less time spent monitoring: teams focus on deviations and their analysis.
Act before things get critical: targeted alerts to the right teams (email, SMS, instant messaging…) as soon as a rule is broken.
Fewer false alarms: limits can be defined according to the context (product, phase, equipment…).
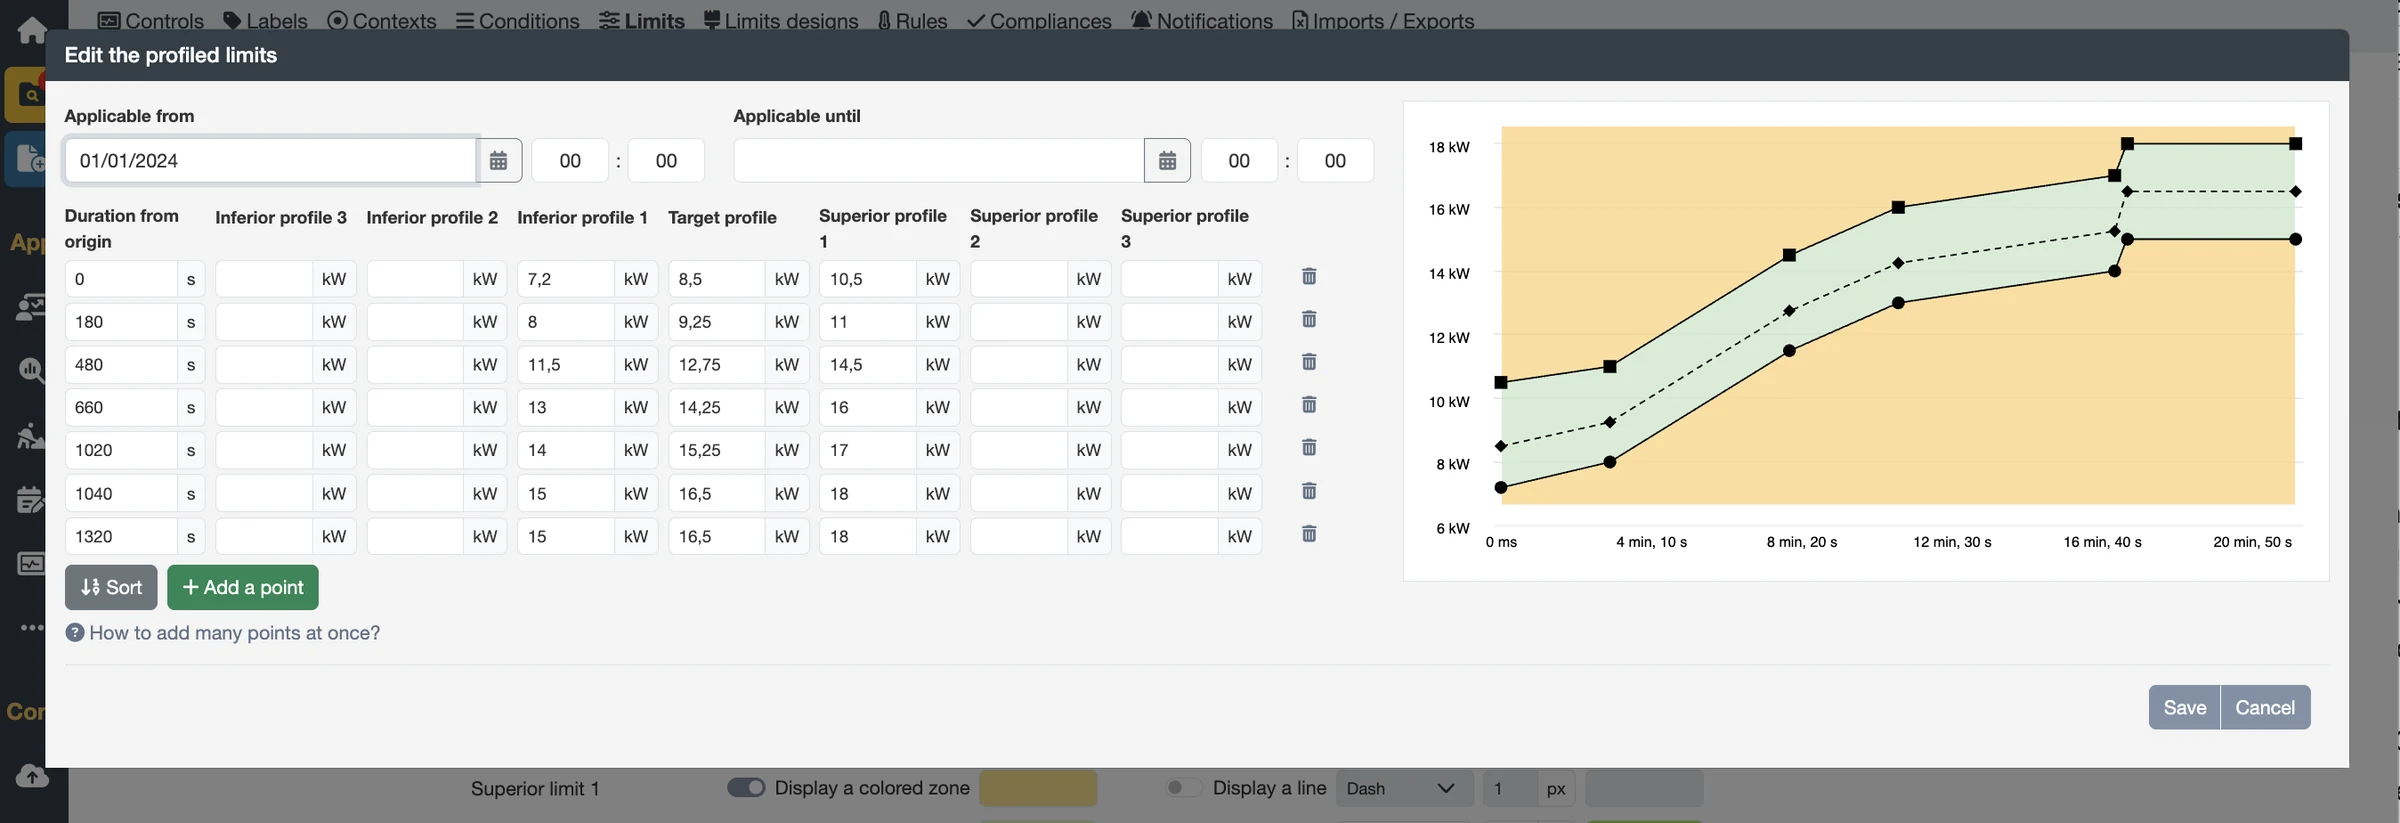
More consistent quality, including in batch processes: every new batch is compared with a target envelope defined from your best production runs (golden batch).
Key features
Limits that depend on the production context (product, phase, shift, equipment…), where most tools impose fixed thresholds.
Native golden batch: define the ideal operating envelope from your best batches and monitor every step of the following ones.
From analysis to monitoring in one click: limits computed by SPC Analysis on historical data are pushed straight into a control configuration.
A wide range of control charts: 3-sigma, I-MR, Xbar-R and Xbar-S, with Cp, Cpk, Cr, Pp and Ppk capability indicators.