Line availability drives both your profitability and your ability to deliver on time. OIAnalytics gives you an accurate view of your OEE or production losses, and of what causes them.
What OEE tracking does
The OEE module calculates, tracks and analyzes equipment performance using the definitions of the ISO 22400-2 standard. Indicators are computed from:
events recorded on equipment (exceptional openings and closures, planned and unplanned stops);
quantities produced versus the expected quantity at nominal rate (performance rate);
scrap versus quantities produced (quality rate).
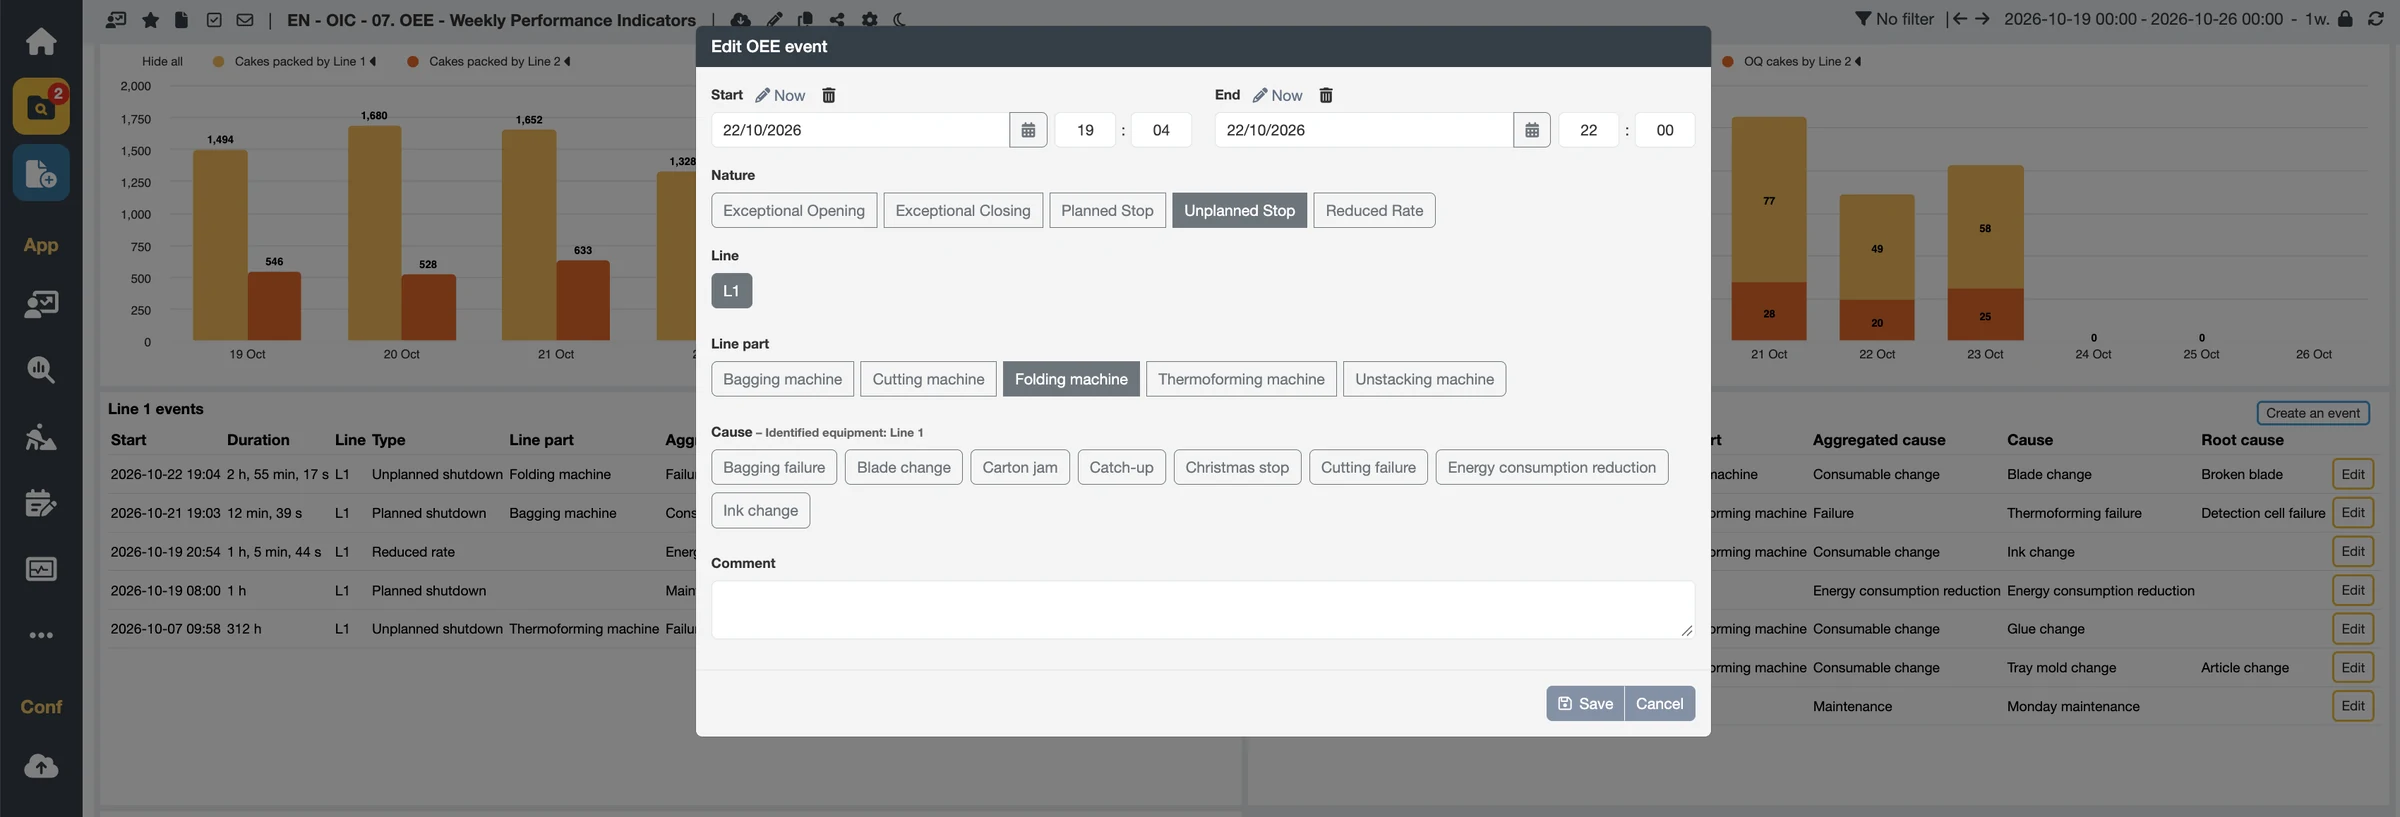
Stops can be detected automatically from equipment data or entered by operators; they can be qualified automatically or by teams from a dashboard.
What you gain
A reliable, shared OEE: standardized, automatic calculation, manual entries kept to a strict minimum, no more uncontrolled Excel files.
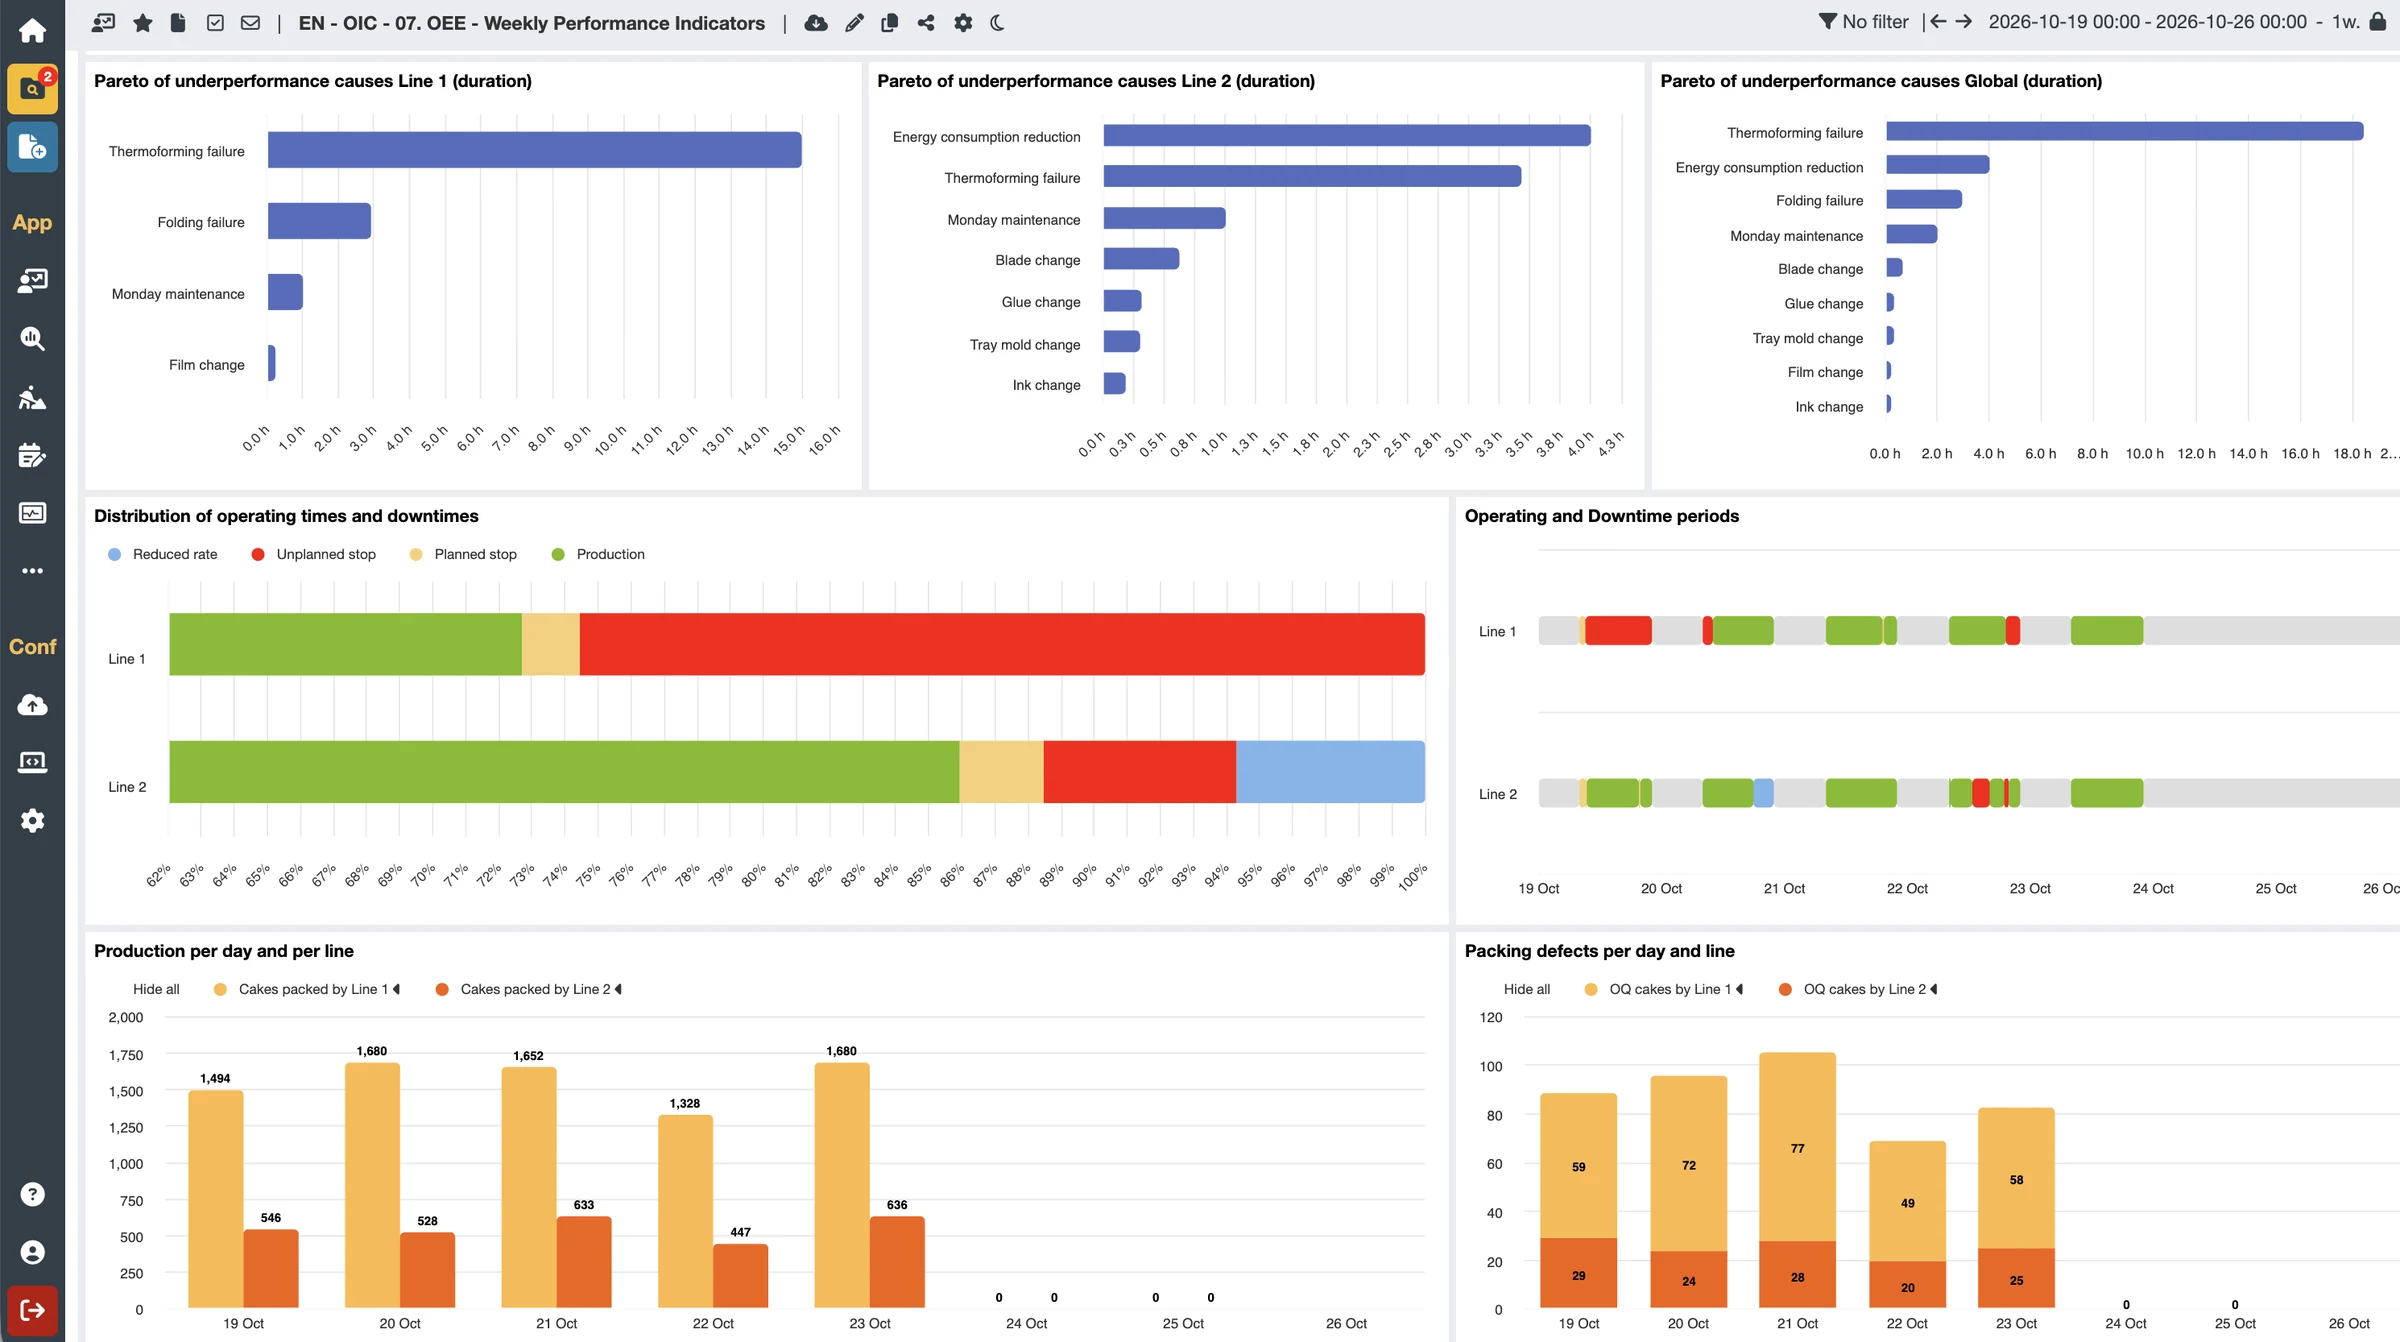
Clear priorities: Pareto charts by cumulative duration and number of occurrences show where to act first.
Engaged operators: they see ongoing stops and slowdowns, complete their qualification in real time and act faster to improve productivity.
Analysis that goes down to root causes: productivity data combines with process, quality and maintenance data to analyze and identify root causes, sustaining performance over time.
Key features
Productivity integrated with the rest of your data: stops and losses are events of the contextualization engine, reusable in advanced analytics, controls and dashboards, whereas a standalone OEE tool or MES keeps them isolated.
OEE or production loss: for non-standard definitions, computed data lets you track your own loss indicators.
Large-scale deployment through assets: equipment group / equipment tree, aggregation by workshop or line.
Weekly operating calendar per equipment, with deviations handled as events.
Stop-cause lists filtered by equipment for simpler, more accurate qualification.
Fixed or time-varying target rate.
Dedicated, preconfigured dashboard module: trend of the 5 key indicators (OEE, availability, performance, quality…), equipment-state timeline (production, planned stop, unplanned stop, reduced speed), downtime breakdown, cause Pareto charts.