Operators, technicians, process engineers, quality teams and managers each need their own view of performance and operations. With OIAnalytics, everyone builds it independently, on trusted data.
What visualization does
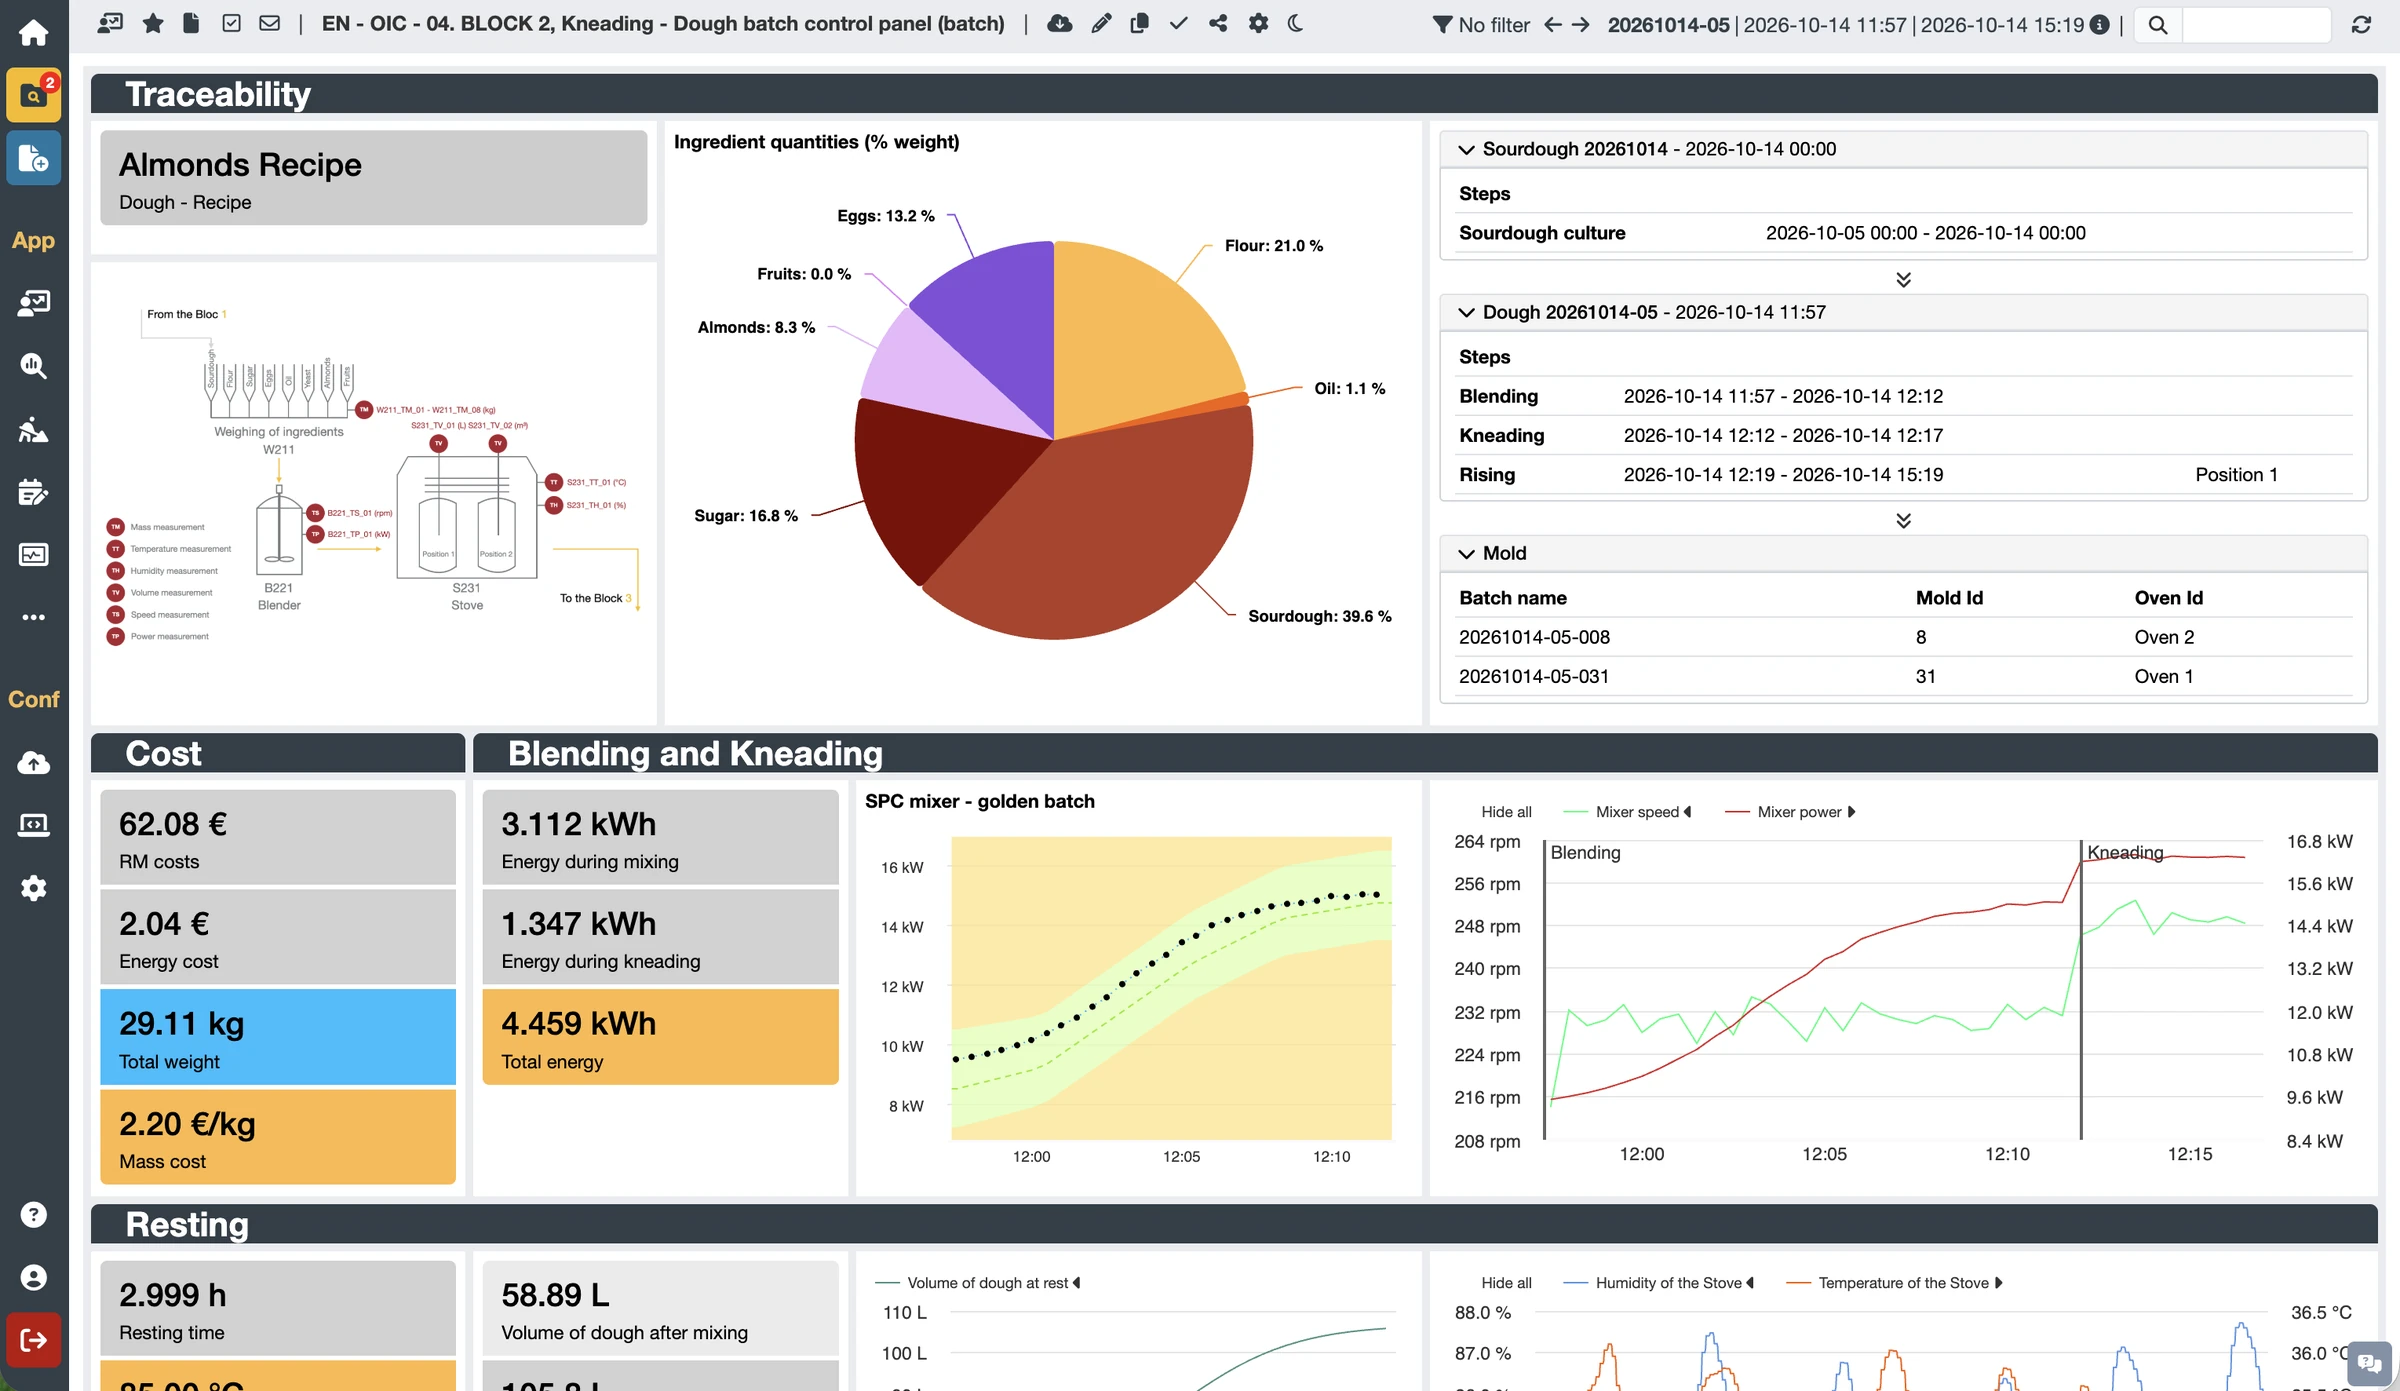
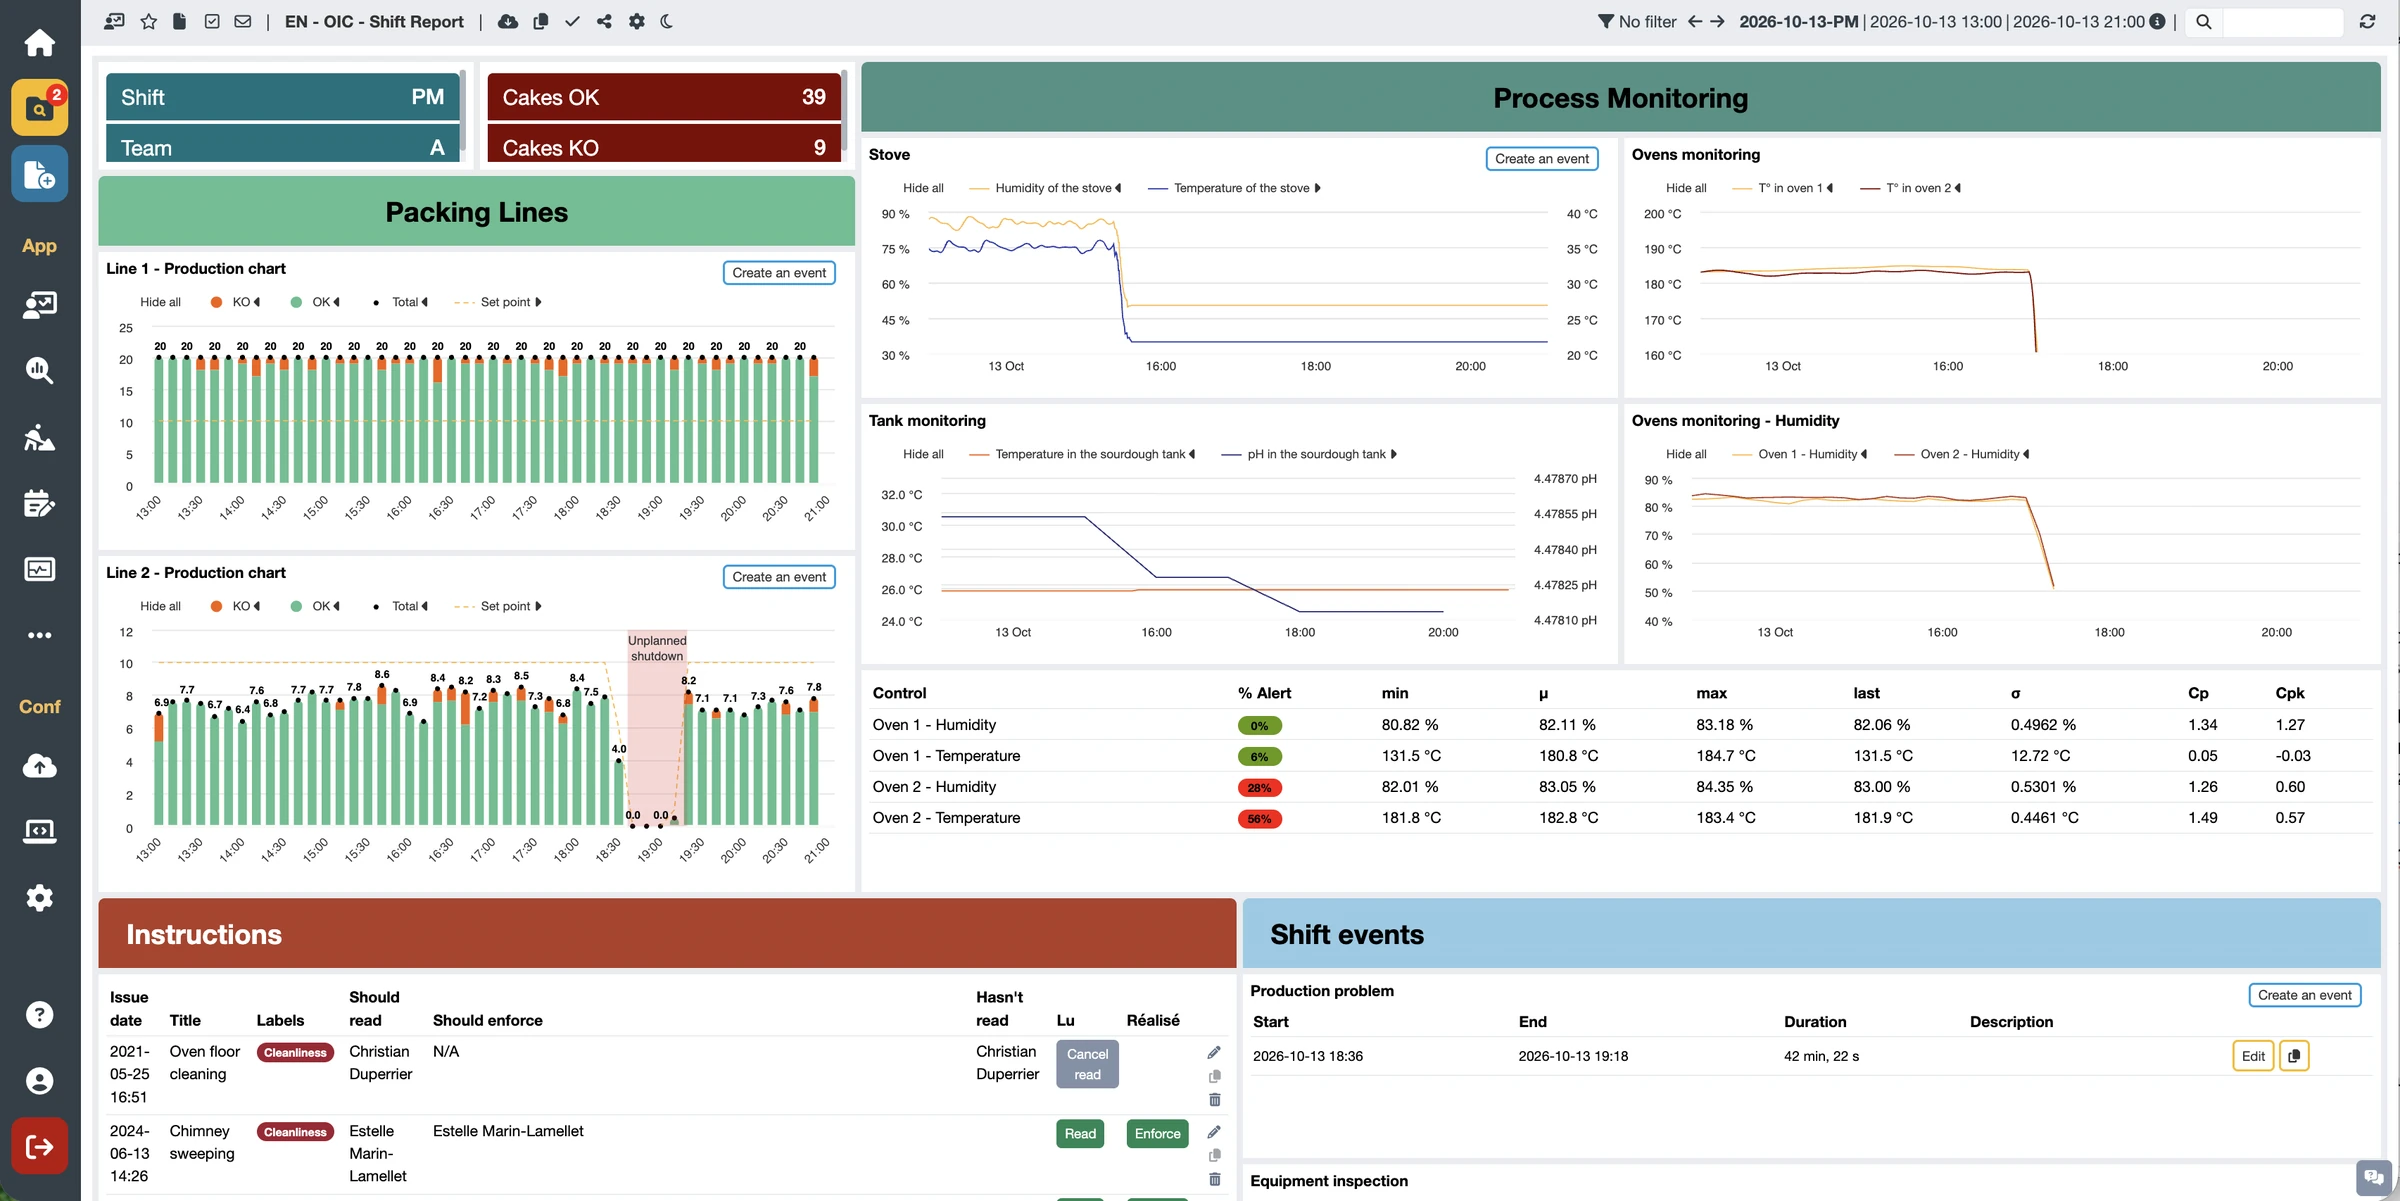
OIAnalytics lets you build dashboards, operations cockpits and reports with a fully modular, flexible approach: a wide range of charts, profile comparison, gauges and counters, control charts, golden batch, Pareto charts, tables, timelines, OEE indicators, batch and event tracking sheets, animated synoptics, and even input forms and instructions.
Each module draws directly on the contextualization engine: pick a batch, a line, a product or a shift and the whole view adapts.
What you gain
A view for every role and scope: control room, shop floor, quality review or management reporting, all built on the same shared data structure.
Less time hunting for information: no queries or Excel extracts; the data is already organized the way your business works and immediately available.
Aligned, standardized KPIs: dashboards published as standards prevent diverging interpretations across departments and sites.
Automated reporting: scheduled, automatic email delivery of dashboards.
Broad adoption: everyone can use it, as our plans include unlimited users.
Key features
Dynamic, context-driven views (time, batches, assets, events) through dynamic tags and filters: one dashboard serves every line, piece of equipment or product.
Visualization and data entry in one interface: forms, shift logbooks and instructions plug in as modules directly within dashboards.
Dashboard governance: controlled creation, validation and publication across a workshop, a site or a group.
Seamless navigation between views through interactive links that keep the context.
Dashboard validation with tamper-proof archiving for compliance.